

Authors | Sources
Le Bijou Blog
Starticker.ch
Le Bijou Blog
Starticker.ch
Finance & Markets
“It wasn’t raining when Noah built the ark”
– Howard Ruff
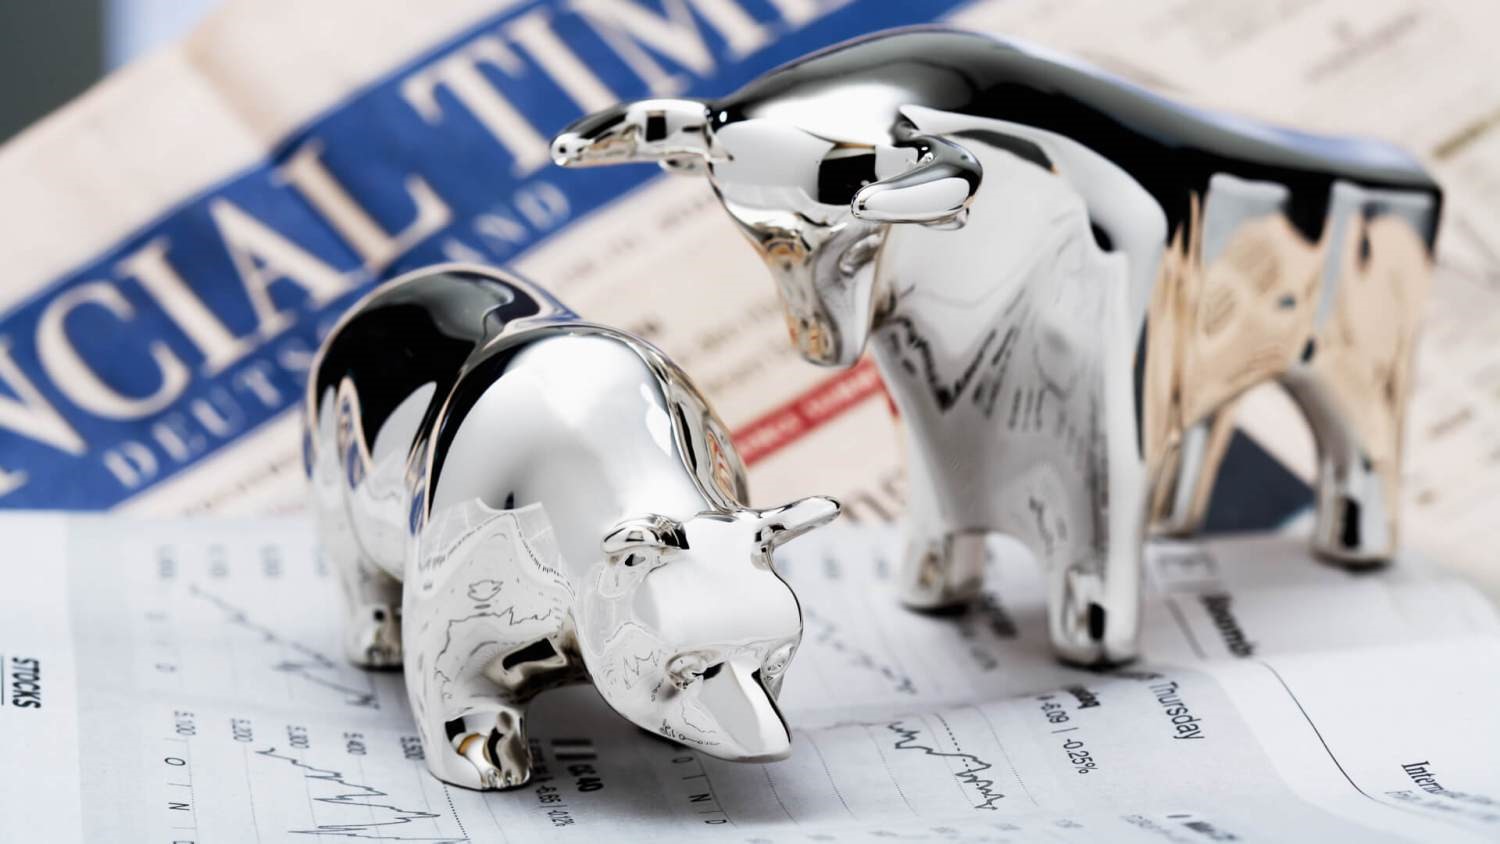
We are experiencing the longest bull market in recent history, with ten consecutive years of rising stock prices. Since 2008, many members of the millennium generation have entered the world of work, and a significant proportion of them have become investors themselves. We are talking about a whole generation of people who are in the market and have never experienced a downturn. It is therefore very easy to be complacent and to infinitely extrapolate the wonderful performance of the last decade into the future.
But history teaches us that market cycles are cyclical. External circumstances can change. Yet excessive greed and fear remain constants, leading to ups and downs. It is dangerous to make a linear extrapolation of past performance and expect it to continue indefinitely.
We are at a stage where the “top rating” is in sight. What often follows is either a soft (correction) or a hard (crash) landing, but in any case a landing. It is therefore important to take action and actively protect your portfolio, regardless of the results of the next 24 months.
In this article we will discuss:
1._Why do crises occur?
2._Proof that the next one is imminent
3._Which assets are most at risk?
4 _What can you do to reduce the risk?
Note: In this article we will mainly refer to the US and UK markets as they are the main market drivers. The dollar is also the most important international currency.
Why do crises happen?
Recessions have occurred regularly in our economic history for various reasons (e.g. economic mismanagement, wars, disease, human greed). Over the last 120 years, and with the exception of the two world wars, recessions in developed economies have tended to be the by-product of the boom-bust cycle, often fuelled by easy access to capital.
The recent downturn (the Great Recession of 2007/09) was a classic example of the credit-driven cycle:
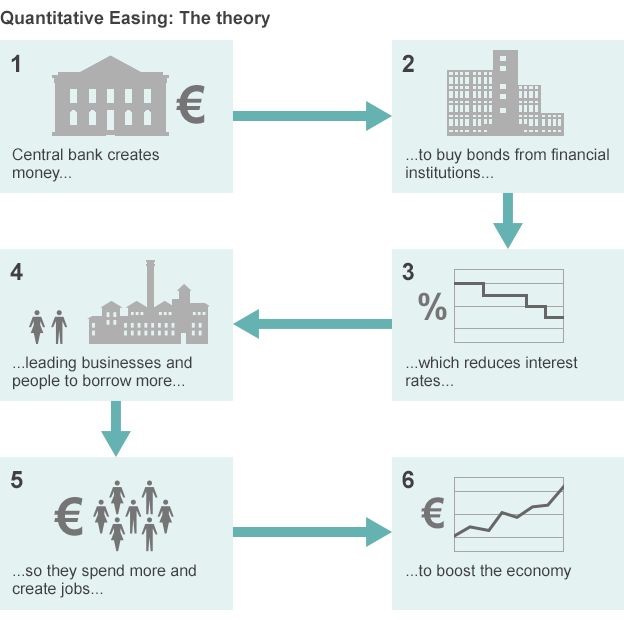
As a result of the Great Recession, the three main central banks of the world (Federal Reserve, Bank of England, European Central Bank) used two key instruments to stimulate stagnant economic growth:
1._Quantitative easing (QL): The creation of “cash” by central banks to purchase financial assets, raise their price levels and maintain market confidence
2._Reduction of interest rates: This lowered the cost of borrowing to encourage investors to borrow and use it productively
The evidence: Why is the next crisis around the corner?
These two instruments have significantly increased overall liquidity in a previously stagnant market. They were undoubtedly instrumental in the rapid economic recovery that followed. However, both instruments also led to a rapid increase (or recovery) in asset prices across the spectrum because:
Due to a decade of quantitative easing and low interest rates, most stock market indices in the industrialised countries recorded a rapid increase in valuation. As a result, these assets were at full price: intrinsic value plus market premium.
The sustainability of such a valuation depends on two conditions:
Recently, however, there have been signs that both factors are diminishing in today’s market and that equity market valuations are becoming increasingly risky.
To be continued in Part 2