

Author | Source
Severin Renold
Weissknight Corporate Finance
McKinsey
Severin Renold
Weissknight Corporate Finance
McKinsey
Connected Mobility
The global automobile industry is on the brink of a vital transformation. Technology is driving this shift, shaped by demographic, regulatory and environmental pressures.
Mobility management has developed into a multi-billion $ industry in Europe and around the world in recent years.
More importantly, connected vehicle data continues to grow and is gaining significant strategic importance in a world of changing mobility. I.e. firstly, the trend towards sharing instead of owning, and secondly, the trend towards self-driving vehicles and electrification.
For example fleet management enables enterprises to track and maintain their vehicles in a cost-effective, quick, and accessible way. It involves functions such as vehicle tracking & diagnostics, financing, driver management, and others. It helps business organizations that depend significantly on transportation to lower or completely eliminate the risks associated with staff cost, operations, and others. Reduced fuel & overall running costs, enhanced safety, and optimized fleet operations, with real-time fleet tracking and monitoring, are the benefits offered by fleet management, which covers only a small part of the overall mobility transformation. However, fleet management is part of the solution towards some of the megatrends in the automotive industry, which will be outlined in the following chapters!

A connected car is known to be a vehicle that can communicate bi-directionally with other systems outside of the car. It is armed with internet connectivity and, in several cases, a WLAN. This permits the car to download software and patches, contact and share data, connect with other internet of things (IoT) devices, and offer Wi-Fi for on-board passengers.
Connected cars provide a unique customer experience while simultaneously delivering cost and revenue benefits to mobility companies, including OEMs, suppliers, dealers, insurers, fleets, tech players, and beyond.
The global connected car market was valued at $ 63 billion in 2019 and is projected to reach $ 225 billion by 2027, registering a CAGR of 17.1%.
Analysts predict that worldwide sales of connected vehicles will reach 76.3 million units within two years, meaning nearly 70% of worldwide new light-duty cars and trucks will ship with embedded connectivity.
The connected car technology of the near future will be a digital platform that uses a multitude of sensors, such as radar, LIDAR, cameras, ultrasonic sensors, and vehicle motion sensors to safely transport passengers and goods. Inside the vehicle, connected cars will provide immersive experiences, in some cases turning the interior of vehicles into virtual theme parks through extended reality (XR) technology. Connected car facilitates connectivity on wheels offering comfort, convenience, performance, safety, and security along with powerful network technology. This enables the driver to connect with online platforms, thereby facilitating real-time communication and sustainability.

Smartphones have changed the definition of connectivity over time. People wish to stay connected with the outer world even while travelling. Now that connectivity has become the need of the hour, automobile manufacturers adopt connectivity solutions in their vehicles to boost their automobile sales. Consumers are expecting their vehicles to perform tasks similar to computers and smartphones.
The automotive data monetization is segmented into on-premises and cloud.

Cloud-based solutions have become the most essential technology for many business professionals across the globe for several simple to complex operations.
The Mobility industry is one of the complex environments that have witnessed rapid technological growth in the last decade.
Cloud-Based Solutions Market designed for all aspects of Mobility is segmented on the basis of deployment type, application, vehicle type and region. Based on deployment type the global market is segmented into private cloud and public cloud. Based on application type the market is divided into Fleet management, infotainment, over-the-air (OTA) updates, telematics, ADAS and other services.
Mobility Cloud-Based Solutions facilitates the flow of data generated from the vehicle, vehicle users and surrounding environment around vehicle and processes the data in order to provide actionable insights, decisions, or tasks to the user.

The Global Electric Vehicle Market size is projected to grow from 4,093 thousand units in 2021 to 34,756 thousand units by 2030, at a CAGR of 26.8% according to MarketsandMarkets. Factors such as growing demand for low emission commuting and governments supporting long range, zero emission vehicles through subsidies & tax rebates have compelled the manufacturers to provide electric vehicles around the world. This has led to a growing demand for electric vehicles in the market. Countries around the world have set up targets for emission reductions according to their own capacity.
Increasing investments by governments across the globe to develop EV charging stations and Hydrogen fueling stations along with incentives offered to buyers will create opportunities for OEMs to expand their revenue stream and geographical presence. The market in Asia Pacific is projected to experience steady growth owing to the high demand for lower cost-efficient and low-emission vehicles, while the North American and European market is fast-growing markets due to the government initiatives and growing high-performance Passenger vehicle segment. However, the low presence of EV charging stations and hydrogen fuel stations, higher costs involved in initial investments, and performance constraints could hamper the growth of the global electric vehicle market. In addition, there is still no comprehensive solution that covers all aspects of the 4 ACES and is accessible as a one-stop shop solution, whereby the number of API interfaces to vehicle data, process data and charging infrastructure in connection with real-time IOT plays an essential role, especially for commercial and public purposes.
Summary of the EV market dynamics
Due to technological advancements and the production of EV batteries on a mass scale in large volumes, the cost of EV batteries has been decreasing over the past decade. This has led to a decrease in cost of the electric vehicles as EV batteries are one of the most expensive parts of an electric vehicle. In 2010, the price of an EV battery was around USD 1,100 per kWh. However, by 2020 their price fell to around USD 137 per kWh while the price is as low as USD 100 per kWh in China. This is because of reducing manufacturing costs of these batteries, reduced cathode material prices and greater volumes of production, etc. The prices of EV batteries are expected to fall to around USD 60 per kWh by 2030, which will greatly reduce the price of EV’s making them cheaper than conventional ICE vehicles.
There is a low number of EV charging stations in many countries around the world. This makes the possibility of public EV charging less thereby reducing the demand for electric vehicles. Although many countries are working on developing EV charging infrastructure, most countries haven’t been able to develop an appropriate number of EV charging stations except in some states. The demand for EV’s will increase once there is a well-developed EV charging network across the world. Most countries are yet to develop such charging networks across their region. The Netherlands has the highest EV charger density per 100 km’s.
Countries around the world have set up targets of around 2050 to reduce vehicle emissions. They have started promoting the development and sales of EV’s and related charging infrastructure. For instance, the US government invested USD 5 billion in 2017 to promote electric vehicle infrastructure such as charging stations. Several governments are providing various kinds of incentives such as low or zero registration fees and exemptions from import tax, purchase tax, and road tax. Furthermore, countries such as Norway and Germany are investing significantly in promoting sales of EVs. Thus, due to the large incentives and subsidies in Europe, a high growth rate in the sale of electric vehicles is observed. This has led to the growth in the demand for components and equipment associated with EV charging operations such as charging cables, connectors, adapters, and portable chargers. Also, as part of a partnership between the US departments of energy and transportation, a 2020 vision for a national fast-charging network has been developed, with potential longer-term innovations which include up to 350 kW of direct current fast charging. Stringent CO2 emission norms have increased the demand for electric vehicles. Governments are investing significantly in providing incentives and subsidies to encourage sales of EVs. These steps taken by governments around the world will help in increasing demand for EV’s in the coming decade.
Factors such as the growth of the electric vehicle market and variation in charging loads have emphasized the need for the standardization of electric vehicle charging stations as well as the corresponding underlying platform and software solution. Certain EV charging stations may only be compatible with a certain type of voltage. For instance, AC charging stations provide a voltage of 120V AC through level 1 charging stations and 208/240V AC through level 2 charging stations. On the other hand, DC charging stations provide fast charging through 480V AC. Governments need to standardize charging infrastructure for the development of a favorable ecosystem and an increase in the sales of EVs. Though, this mandate increased the installation cost of charging stations and hence in July 2019, the government changed the guidelines and allowed charging station developers to choose the method they prefer. US-based electric car maker Tesla uses high-performance superchargers that are unique to Tesla and cannot be used for other EVs (which might change in the near future). The lack of standardization across countries may impact the installation of charging stations and hamper the growth of the Electric Vehicle Charging Station market.
The electric vehicle market for passenger cars is largest in Asia Pacific followed by Europe and North America. In Asia, China, Japan and South Korea are the countries leading the passenger EV market in the region. This is due to the strong government support for passenger EV’s in these countries. Germany, France, Netherlands, Norway, Sweden, UK, etc. are the top countries in the European region with a growing demand for EV passenger vehicles. These countries have come out with string of emission regulations and a variety of subsidies, grants and incentives for shifting to EV’s. in 2020, due to these measures, Europe’s EV sales went beyond China’s EV sales. North America is also increasing EV passenger car demand with various states in US and Canada leading the electrifying trend. MEA countries have started to increase their EV’s market and are expected to be the fastest-growing market in the coming years.
Those who succeed in breaking down these silos will make an important contribution to simplifying and implementing sustainable electrification and accelerating mass adoption. This also goes hand in hand with the consumer shift from a seller’s to a buyer’s market and today’s trend to use goods and services cost-efficiently and sustainably in the short term to satisfy a specific need. Therefore, the idea of ownership is increasingly fading into the background in favour of shared services. Airbnb, Uber and WeWork are just a few prominent examples of this shift and especially in the transport/mobility and logistics sector (with almost no industry directly excluded), we see increased initiatives to further promote this. These include car, bike, scooter and other shared services, which should contribute to providing sustainable and cost-efficient solutions for reducing CO2 emissions in cities and suburban areas, reducing traffic congestion and making transport and mobility smarter, and also promoting safety and maintenance in the context of connected and autonomous vehicles.
The shared mobility trend
According to McKinsey’s 2020 ACES consumer survey, more than 60 percent of people would share their shared-mobility ride with a stranger if doing so would add less than 15 percent to their travel time while reducing their cost. In recent years, new modes and services have emerged, such as pooled ridesharing with strangers, peer-to-peer car sharing (driving a stranger’s private car), and shared electric scooters, pointing to a sizable potential market in the mobility space. The next big things include autonomous taxis (so-called robo-taxis) and airborne varieties, which have seen a huge investment acceleration and traction in recent months.
The shared-mobility market accounted for approximately $130 billion to $140 billion in global consumer spending in 2019. Out of this, e-hailing accounted for the largest share, $120 billion to $130 billion, which is more than 90 percent of the total market. Taken together, car sharing and peer-to-peer car sharing account for less than 10 percent of this market, which reflects e-hailing’s higher convenience (that is, the customer is driven, can spend the time in the vehicle on other activities, and does not have to find a parking space).

McKinsey’s forecast shows micromobility could reach a consumer-spending potential of $300 billion to $500 billion globally by 2030 (combining shared and private micromobility), thus becoming three to four times larger than today’s global e-hailing market. This amount could grow even higher as the pandemic winds down and normal activities resume.
Since 2010, more than $100 billion has been invested in shared-mobility companies. Looking deeper into types of investors, it’s not the automotive players that are investing in shared-mobility companies. Instead, around 72 percent of the total amount of disclosed investment since 2010 has come from venture capital and private-equity players, suggesting a bet on the future rather than on established and already sustainable business models. Tech players are second at approximately 21 percent, while automotive-company investments amount to approximately 4 percent. One reason for the traditional automotive industry’s lackluster showing could involve shared mobility’s potential for disrupting an automotive player’s core business. Some automotive OEMs have attempted to face the challenge through in-house initiatives rather than investments in external, new startups. This displays a mindset shift from selling vehicles to providing shared-mobility services, while the latter may even cannibalize OEMs’ core business of selling cars to private individuals.
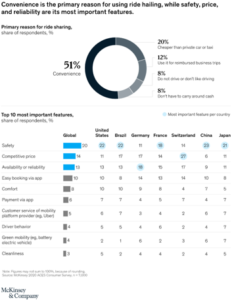
Survey respondents said that their main reason for using shared mobility is convenience. This reflects today’s dominance of e-hailing over other shared-mobility modes. The most important features of shared-mobility services for consumers are safety, a competitive price, and availability. The latter, especially, might be an important factor in shared mobility’s ability to replace private-car ownership in the long term. Notably, availability is the most important feature for German consumers.
Severin Renold
Weissknight Corporate Finance
Luxury and Watch Market
In the past year, the value of the US dollar has risen against most major currencies, driven by the relative strength of the US economy, the expectations of tighter US monetary policy and other known factors.
The global luxury goods sector is expected to grow more slowly in 2022, at a rate many retailers may find disappointing. The growth rate is slowing in important markets such as China and Russia, although some markets continue to perform well, and there are pockets of opportunities across the globe. India and Mexico for example, are proliferating, and the Middle East offers further growth potential. The European luxury goods market has bounced back since the difficult days of the middle of 2010-2020, but national economies are growing at different rates. Overall, market growth is slow but steady, with both domestic shoppers and wealthy tourists cautious about spending.
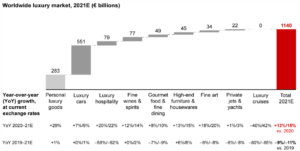
The global luxury market exceeded €1.1 trillion in 2021 – a strong growth of more than 15% following the contract in 2020 due to the pandemic.

The Global Watch Market was valued at $ 93 billion in 2021 and is projected to register a CAGR of 5.02 % during the forecast period (2022-2027).
China, Japan, and India significantly contribute to the sheer market value of the watch in the Asia-Pacific region. China is one of the most competitive markets in the world, as it offers enormous potential for manufacturers of luxury watches to acquire and compete. China accounts for over half of watches exports in the world in 2020 as per ITC Trademap. Rolex, Omega, Patek Philippe, Cartier, Channel, Longines, Tissot, Rado, Blancpain, and Piaget are some of the prominent luxury watch manufacturers having presence in the region. These Swiss watches are loved across the globe; in 2021, it witnessed a growth of 3.5 % in watches exports when compared to 2019.
There is no official data on the world’s production of watches. If it can be estimated at about 1.3 billion pieces, export and import results are higher because a product may be re-exported and thus be counted twice. However, these data reflect the forces involved very well and help identify trends facing the industry worldwide.
Only a handful of countries dominate the global watch industry. Ten countries – Switzerland, Hong Kong, China, Germany, France, Singapore, Italy, Japan, the US, and the UK – account for more than 90% of global exports of watches and watch parts, the first three being way ahead of the others. The fact that these 10 countries are simultaneously the most significant importing countries is evidence of the high degree of interdependence between their watch industries. The individual countries are, to some extent, specialized in different watchmaking products and steps in the production process.
Leading watch-exporting countries worldwide in 2019 & 2020, based on the number of units

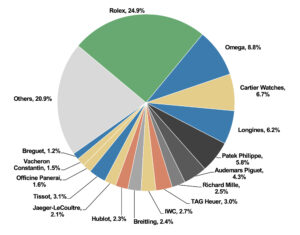
Between them, the Swatch Group, Richemont and Rolex constitute about 50% of the global watch market and are considered key players in the industry. Fossil (USA) is in the fourth position; it overtook the place of LVMH. The three largest Japanese watchmaker players (Citizen, Seiko and Casio) have 10% of the market share, having still fewer shares than Rolex alone.
Estimated market share of the leading watch brands worldwide in 2020
Watch-making is divided into two distinct branches: luxury watches (Haute-Horlogerie) and the fashion segment (low-end).

In order to understand the strategic choice of watch companies of where to produce and what key factors should be analyzed, the process of making a watch needs to be defined. When a company decides to delocalize or change its centre of production, there is always a reason why it is done. First of all, every watch needs to be elaborated on computer design. Major brands, including Rolex, Swatch, and Patek Philippe, have their own design offices within their company, but small independent design companies exist for brands that decide to outsource their design phase. Raw materials that can be used vary from the quality and price of the watches. Basic and low-end watches are made of plastic, titanium, or stainless steel, whereas luxurious watches are made of silver, gold, carbon, diamond, platinum, or ceramic. Thus, raw materials need to be accessible on the production/manufacture site. The manufacturing process is one of the most important steps and is divided into two phases. The first one is about shaping and tailoring the components of the watch. It can be hand-made or machine-made. The second one, which is the most noteworthy because it requires excellent knowledge and skills, is the process of manufacturing and assembling the watch components. Labour must be qualified to operate on specific machinery to shape particular parts. Thus, the location of this manufacture must be studied very cautiously because of the need for skilled labour and the availability of adequate machinery.
Quality control is the last step before the watch is shipped to retailers. It consists of checking possible defects to ensure high quality. This control can be made at the end of the production line for small and low-end watches, but the most luxurious and essential brands set the control at the earliest point of the manufacturing process.

The Great Hong Kong region clock & watch industry is the most crucial key player in the industry together with the Swiss one. Yet, a difference lies between production and sales. If the Great Hong Kong region is perceived as a competitor in terms of brand production in Switzerland, it is not the case in the retail sector as it is the largest market for Swiss brands, which realize the majority of their sales there (in Hong Kong only). Chinese domestic firms aiming to compete in the low-end segment want to upgrade their production to move to the middle and high-end verticals.
Severin Renold
Weissknight Corporate Finance
Real Estate, Mobile Housing
Real estate is a significant component of the economy’s capital stock and households’ wealth, which serves as both a crucial input for producers and providers of residence. Investment in real estate can be categorized according to its use as either commercial or residential.
As a result, the construction sector lies in an influential position as a significant contributor to the business cycle.
The construction industry, and its broader ecosystem, are the foundation of our economies and are essential to our daily lives.
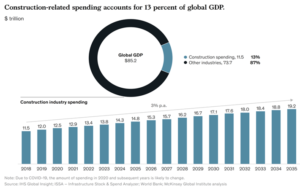
Construction, which encompasses real estate, infrastructure, and industrial structures, is the largest industry in the global economy, accounting for 13% of the world’s GDP.
The lagging performance of the construction industry is a direct result of the fundamental rules and characteristics of the construction market and the industry dynamics that occur in response to them. Cyclical demand leads to low capital investment, and bespoke requirements limit standardization. Construction projects are increasingly complex, and logistics must deal with heavy weights and many different parts. The share of manual labour is high, and the industry has a substantial shortage of skilled workers in several markets. Low barriers to entry in segments with lower project complexity and a considerable share of informal labour allow small and unproductive companies to compete. The construction industry is extensively regulated, subject to everything from permits and approvals to safety and work-site controls, and lowest-price rules in tenders make competition based on quality, reliability, or alternative design offerings more complicated.
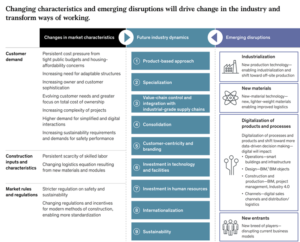
The construction industry was already starting to experience an unprecedented rate of disruption before the COVID-19 pandemic. In the coming years, fundamental change is likely to be catalyzed by transformations in market characteristics, such as scarcity of skilled labour, persistent cost pressure from infrastructure and affordable housing, stricter regulations on work-site, sustainability and safety, and evolving sophistication and needs of customers and owners. Emerging disruptions, including industrialization and new materials, the digitalization of products and processes, and new entrants, will shape future dynamics in the industry.
Customers and owners are increasingly challenging, and the industry has seen an influx of capital from more savvy customers. Client demands are also evolving regarding performance, TCO, and sustainability: smart buildings, energy and operational efficiency, flexibility and adaptability of structures will become higher priorities. Expectations are also rising among customers, who want simple, digital interactions as well as more adaptable structures.
Towards a zero-emission, efficient, resilient building and construction sector.
The EU Member States retain the competency to regulate issues such as safety, indoor air quality, noise and radiation. They also have the responsibility to implement European legislation. Local authorities have an essential role to play in the promotion of low-carbon and resource-efficient cities, building on the involvement of stakeholders and citizens.

CO2 emissions from the building sector are the highest ever recorded:
This industry must eliminate all CO2 emissions from the built environment by 2040 to meet 1.5° climate targets.

Development and implementation of new technologies are needed to reduce the demand for construction materials and enable their circularity and contributions to resilience.
Adopting offsite (modular) construction for disassembly and enhancing additive manufacturing with closed-loop materials for waste avoidance will further result in material efficiencies.
Offsite manufacture for construction is a manufacturing-based approach involving the production of components of buildings (e.g., foundations, roof cassettes, walls, floors, kitchen, and bathroom units) or whole (modular) units of a building in a factory for installation on-site. Offsite construction manufacturing is increasingly associated with greater use of digital technologies at different process stages.
The need to address sustainability challenges has been brought to the fore on the agenda of the whole sector. Emphasis on energy efficiency standards, and commitments to reducing carbon emissions across the construction industry, also derive from the world’s leading governments’ commitment to achieving carbon net-zero by 2050.

There are numerous benefits of non-traditional and offsite construction, including the speed of on-site operations; fabrication quality; safer working conditions; material efficiency, reduced waste; and less noise and disruption for residents and neighbours:
The potential for offsite and modular technologies to help tackle the problems related to the housing crisis and open up opportunities for advances in the construction sector is widely recognized. These innovations could deliver faster construction speed, better quality of housing and could provide a ‘golden thread’ of information needed for effective management and maintenance of housing.

Tiny homes are full-fledged dwelling units that are less than 500 square feet and have the basic amenities of a permanent home. They have evolved over the recent decades and come in many styles and designs, appealing to people from all walks of life, retirees, starter home-seeking couples, and minimalist young people, among others. Tiny homes offer a wide range of quality, affordable, and environmentally friendly housing that can be used to meet personal dreams, financial and lifestyle goals, and community needs.
The market share is expected to increase by USD 3.57 billion from 2021 to 2026, and the market’s growth momentum will accelerate at a CAGR of 4.45%. In 2022, North America is expected to dominate the market due to changing lifestyles and the rise in investments and initiatives towards the construction of tiny homes for both commercial and residential.
The key factor driving growth is its affordability by the mass section of the population. Tiny homes are recognized as the most affordable housing system, preferred especially by millennials as recent studies show. Tiny homes are just a fraction of the price of traditional homes and can be designed based on customers’ requirements. Increasing usage of tiny homes in tourism activities is another important driver for the global tiny homes domain. The rising inflation leading to a rise in living costs and the increasing popularity of affordable housing solutions, and the tiny-house movement are expected to propel the development of the global sector.

Tiny homes do not require permits in many parts of the world as they are considered vehicles depending on their size and specificities. Many families have invested in tiny houses and then rented them to people. Some service providers even rent their tiny homes in various architectural and decor styles. These styles depict modern or minimalist to rustic or traditional as a unique alternative to the hotel stay. They equip the tiny homes with a kitchen, living space, bathroom, and sleeping area. Various factors, such as globalization, internet penetration, and growing social media influence, have boosted the demand for tiny homes. Furthermore, new lifestyles, higher disposable incomes, and increasing consumer environmental awareness create demand. This, in turn, is expected to act as a driver for the growth of the global market in addition to the recently emerging trend for mobile houses, which are easier to set up and dismantle and therefore also offer short-term possibilities for use.
Severin Renold
Weissknight Corporate Finance
BioTech, Gene Therapy
Serious diseases have traditionally been treated using drug therapy, which aims to manage the disease rather than cure it. More recently, advanced gene-therapy products, such as lentiviral vectors, have been used to permanently restore health to those suffering from severe disease.

The basic idea of gene therapy is to introduce genetic material into cells to replace mutated genes or provide instructions to produce an advantageous protein.

For the gene of interest to reach the inside of the cell, it has to be packaged into a carrier vehicle. Mostly, these vehicles are viral vectors, but there are also non-viral carriers. Viral vectors are most often used as carriers because they can deliver the gene of interest with high efficiency using the natural mechanism for infecting cells. The viral vectors are engineered, so they are incapable of causing disease in humans. In gene therapy, the viral vector is composed of the capsid, the virus’s protein shell that carries the genetic material and envelope proteins that allow for binding and entry into the targeted cell.
Gene Therapy Delivery Vehicles:
The inability of viruses to self-replicate unless they infect a living cell is a fundamental reason they have become so valuable for gene therapy development. In essence, viral vectors are modified viruses that contain the viruses’ gene delivery skills while their pathogenic characteristics have been removed. A number of viral vectors have been developed to introduce genetic material into target cells. In gene therapy, the cargo can either replace a mutated, disease-causing gene with a healthy gene, inactivate an improperly functioning gene, or introduce a new gene into a patient’s body to help fight a disease. Today, there are four main viruses used as biotherapeutic vectors: retroviruses, lentiviruses, adenoviruses, and adeno-associated viruses. Each of these viral vectors comes with its own limitations and advantages.

A number of drawbacks associated with viral vectors have led to the study and development of non-viral vector solutions for gene therapy delivery into target cells or tissues. These drawbacks include manufacturing bottlenecks, upscaling challenges, cancer-causing mutations, and immunogenicity of viral vectors.
Non-viral administration methods can address a number of these limitations, especially those associated with safety. Synthetic gene therapy delivery vehicles, for example, usually have lower immunogenicity than viral vectors because patients will not have pre-existing immunity, which is the case with some viral vectors. Many non-viral vectors are also easier to manufacture and can deliver much larger genetic cargoes than some viral vectors.
Despite these advantages, very few of these non-viral vector solutions are actually used in the clinic, as they have their limitations. The main challenge currently facing non-viral vector solutions is the effective delivery of genetic material into mammalian cells due to many barriers, such as potential vehicle degradation before it can even reach the target cell.

The Gene Therapy Market was estimated to be $ 4.2 billion in 2021 and is poised to grow at a CAGR of 26% by 2027 to reach $ 14.8 billion.
Investment in research and development (R&D) activities are also expected to have a significant effect on the market. Several companies aim to build a gene therapy platform with a strategy focused on establishing a transformational portfolio through in-house capabilities and enhancing those capabilities through strategic collaborations, expansion of R&D movements, and potential licensing, merger, and acquisition activities.
Based on indication, the market is segmented into neurological diseases, cancer, hepatological diseases, Duchenne muscular dystrophy, and other symptoms.
The global gene therapy market is highly competitive and consists of a few major players. Companies like Amgen Inc., Bluebird Bio, Gilead Sciences, Inc., Novartis AG, Orchard Therapeutics, Sibiono GeneTech Co. Ltd., Spark Therapeutics (Roche AG), and UniQure N.V., among others, hold the substantial market share in the Gene Therapy market. They have various strategic alliances such as collaborations and acquisitions along with the launch of advanced products to secure their position in the global market.
In Europe, there are more than 300 biotech and pharma companies working in the gene therapy field, while there are over 600 in North America, according to GlobalData. A large number of small and medium-sized biotechs are developing gene therapies, and numerous big pharma companies are also working in the field, as mentioned earlier.

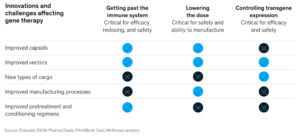
1) Challenges to realizing the potential of viral-vector gene therapies:
The current generation of viral-vector gene therapies represents the culmination of decades of biological and clinical research. As more patients have received these therapies, it has become clear that three fundamental challenges will restrict the applicability of viral vectors: getting past the immune system, lowering the dose, and controlling transgene expression. Ongoing work to address these challenges is generating technological innovations that have the potential to leapfrog current therapies and unlock the potential of viral vectors.
To tackle gene therapy hurdles, academic labs, start-ups, and established companies are generating various innovative solutions. Each focuses on a specific component of a gene-therapy product (for example, the viral capsid) or part of the development process (such as manufacturing). However, these creations often address considerable core challenges, outlining multiple paths to realizing the promise of viral-vector gene therapy.
Future trends:

The manufacturing challenges:
As explained above, the early stages of gene therapy development involve continuous biophysical analyses and safety testing of the therapy’s viral and genetic components to ensure the safety and efficacy of the treatment when used in humans. However, challenges also pop up throughout different stages of the gene therapy manufacturing process.
Another challenge related to process development is the fact that each disease and each target tissue requires a different dosage.
Moreover, a lack of optimized processes and fast testing is seen as one of the main drivers of the high costs of gene therapies. To address this problem, researchers are working on the development of new analytical methods like robust, fast, easy-to-use, and reproducible assays. These should be developed only for gene therapy assessment rather than being borrowed from traditional antibody development processes, as is currently the case.
Severin Renold
Weissknight Corporate Finance
The sustainable fashion trend
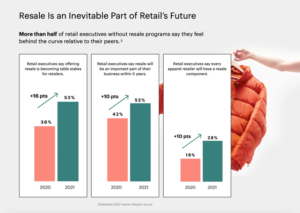
The retail industry is in the process of undergoing a radical transformation, whereby sustainability has redefined consumer preferences and values and become a competitive advantage among retailers.
Consequently, critical factors such as the spread of environmental and ethical consciousness and the related legislation had triggered a new trend for both fashion retailers and brands, namely secondhand resale services. Fashion brands are now looking into resale strategies in order to benefit from the fast-growing secondhand market.
The textile industry is in a paradigm shift due to increasing awareness and demand for more sustainable ways of producing our clothes.

The fashion market statistics show that the apparel and textile sector is the 4th biggest globally: the industry has a labour force of 3,384.1 million. Its value is equivalent to 3 trillion dollars. That means it corresponds to 2% of the world’s Gross Domestic Product (GDP).
The fashion industry is one of the most challenging industries impacted by hundreds of factors, including economic uncertainties and digital transformation. In response to this new digital wave, consumer expectations have reached an all-time high. Shoppers are no longer content with the simple purchase transaction; they want to have an experience attached to it. For fashion brands, this means that they have to become digitally savvy to be flourishing.
Sustainability dominates consumer priorities and the fashion agenda.
Fast fashion – the constant production of new styles at very low prices – has led to a big increase in the quantity of clothes produced and thrown away. This impact is often felt in third countries, where most production takes place. The production of raw materials, fabrics and dyeing require enormous amounts of water and chemicals, including pesticides for growing raw materials such as cotton. Consumer use also has a large environmental footprint due to the water, energy and chemicals used in washing, tumble drying and ironing, as well as to microplastics shed into the environment.
It is estimated that the fashion industry is responsible for 10% of global carbon emissions. That is more than international flights and maritime shipping combined.
Used clothes mostly end up in landfills. Various ways to address these issues have been proposed, including developing new business models for clothing rental, designing products in a way that would make re-use and recycling easier, convincing consumers to buy fewer clothes of better quality, and steering consumer behaviour towards choosing more sustainable options.

Sales of fashionable clothing and goods, as well as related services represent approximately the overall so-called Fast Fashion Market.
The global fast fashion market is relatively fragmented, with a large number of small players. The top ten competitors in that space made up 29.13% of the total market in 2020. Notable players include Inditex (Zara SA), H&M Group, Fast Retailing (Uniqlo), The Gap, Inc., and ASOS Plc.
However, and more than ever, sustainability dominates consumer priorities and the fashion agenda.

Ecological impact:
In terms of waste and recycling:
Since 1996, the amount of clothes bought in the EU per person has increased by 40% following a sharp fall in prices, which has reduced the life span of clothing. The way people get rid of unwanted clothes has changed, with items being thrown away rather than donated. Europeans use nearly 26 kilos of textiles and discard about 11 kilos of them every year. Used clothes are mostly (87%) incinerated or landfilled.
Recent studies indicate that the most efficient way to minimise the environmental impact of the textile industry is to increase the number of times each garment is used. This has led to the promotion of circular economies and the secondhand market.
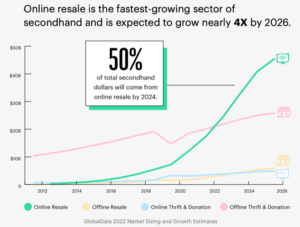
In 2019, secondhand market expanded 21 times faster than conventional apparel retail. Furthermore, the global secondhand clothing market is projected to grow 127% in just 5 years. The biggest growth is estimated to come from new resale models including online secondhand.
Fast fashion, which contributes to pollution, climate change, and unethical labour practices, has given way to the sustainable fashion movement.
Consumer demands, circular economies and online marketplaces are driving the growth of the second-hand market. This has led to an increased monetary value of secondhand items – good quality clothes are no longer considered as trash.

Legislation is starting to put more and more of the pressure on textile industry. In March 2022, EU Commission launched a new Circular Economy action plan.
The Action Plan presents new initiatives along the entire life cycle of products in order to modernise and transform economy while protecting the environment. It is driven by the ambition to make sustainable products that last and to enable our citizens to take full part in the circular economy. Driving new business models will boost sorting, reuse and recycling of textiles, and allow consumers to choose sustainable textiles. Ecodesign will apply to a broader range of products: clothes will be made to last longer.
The Commission also presented a new strategy to make textiles more durable, repairable, reusable and recyclable, to tackle fast fashion, textile waste and the destruction of unsold textiles, and ensure their production takes place in full respect of social rights.
As consumers become increasingly concerned by the environmental impact of clothes production, transportation, and waste (greenhouse gas emissions, water consumption, landfills), many increase their second-hand consumption to limit their carbon footprint.
Resale platforms especially drive the second-hand market boom.
They are expected to go from $15 billion in 2021 to $47 billion in 2025 in the US only.

And the leading marketplaces have raised hundreds of millions of dollars in just a decade: Vestiaire Collective raised $ 240 million, The RealReal $ 357 million, Vinted 260 million, Depop $105 and ThredUP $ 305 million.
Until now, the second-hand market has almost entirely been running outside the fashion industry and its core brands.
As the second-hand trend is becoming more mainstream, it has drawn the attention of traditional brands.
More and more brands are creating new concepts to include second-hand alternatives on top of their traditional offer. In that respect, 60% of fashion retailers have presented or are open to providing second-hand to their customers.
Thanks to new and innovative business and earning models, the fashion industry is moving into more sustainable practices. The circular solution developed allows fashion brands to benefit from the rising value of secondhand garments.

Severin Renold
Weissknight Corporate Finance
Content Marketing
Revenues for online businesses, publishers and/or websites are hugely dependent on advertising spending. But digital advertising can become quickly very expensive, while other methodologies can achieve the same purpose – selling more, like for example, “content marketing”.
What is content marketing?
In general, content marketing is a marketing technique that involves creating and spreading contents valuable from the point of view of recipients of the content, aimed at drawing attention and engaging a community gathered around a particular target group. Content is what users want to read, learn about, watch or experience. From the perspective of business, content is important information presented on a website, in an application, or by other available channels of digital presentation, which have the mission of communicating.
Nowadays, content marketing is not just a desirable thing; it’s a must-have. Moreover, it is necessary to create up-to-date content.

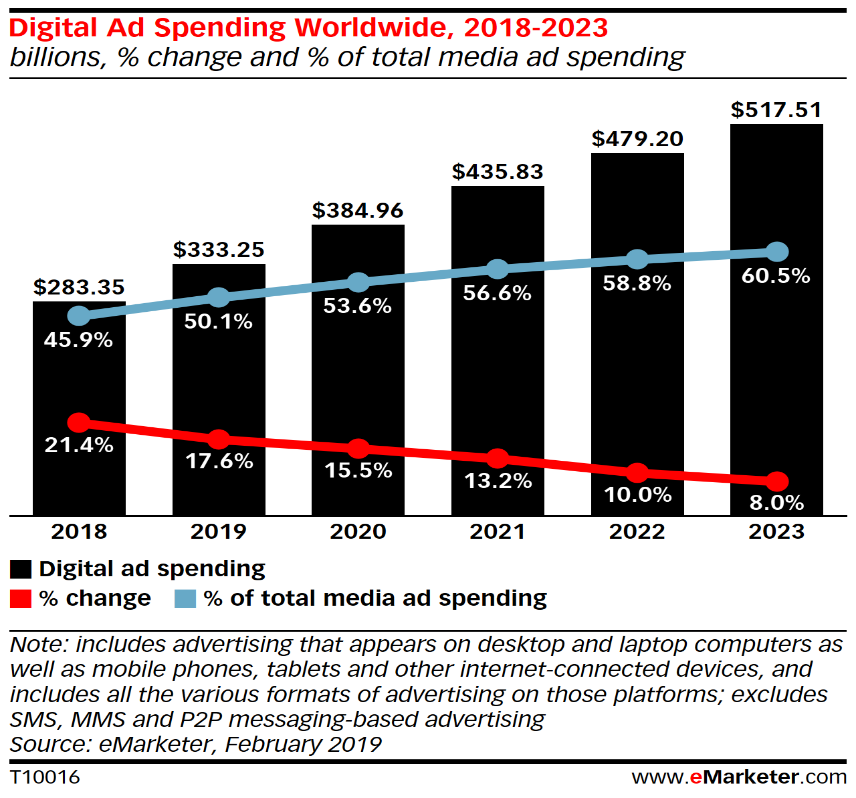
The world of media is changing rapidly, and long-term beliefs about value sources in a given business model, media segment, or geography are also evolving. Spending on media continues to shift from traditional to digital products and services. By the end of the year, experts believe digital spending will account for 60% of overall media spend. Digital, consisting of Internet- and mobile advertising, will become the largest advertising category in the coming years (surpassing TV), and mobile will more than double its share of the digital ad market.
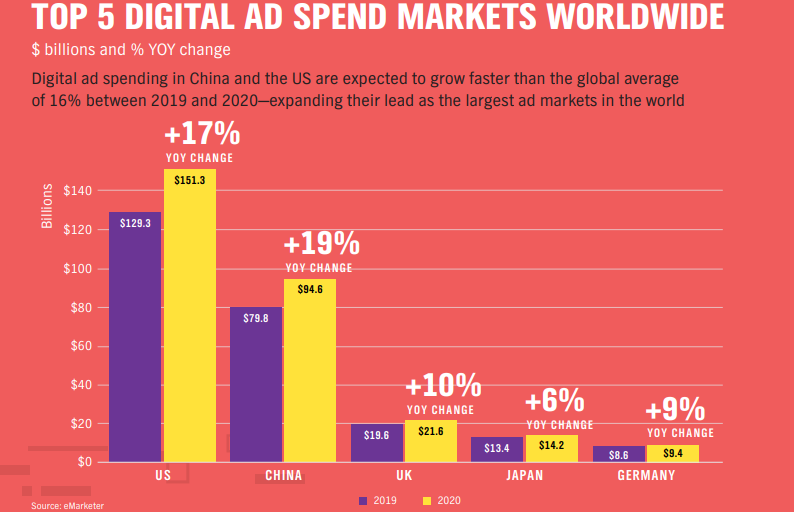
In 2020 advertising spending continued to rise globally, with digital driving most of the growth with an increase of 17.6% YoY to $ 333 billion.
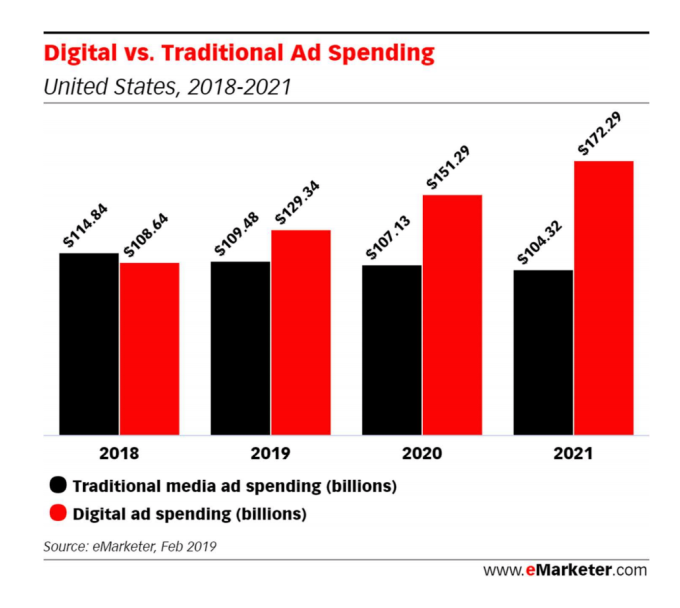
Specifically, in the US, digital ad spends will increase by 19.1% to $130 billion, while traditional advertising will fall 19% to $110 billion. That means digital will account for 54.2% of the total, while traditional will only represent 45.8%. The gap between digital and traditional will continue to widen, and by 2023 digital will account for more than two-thirds of total ad spending.
While digital ad spending will rise, data also shows two key trends:
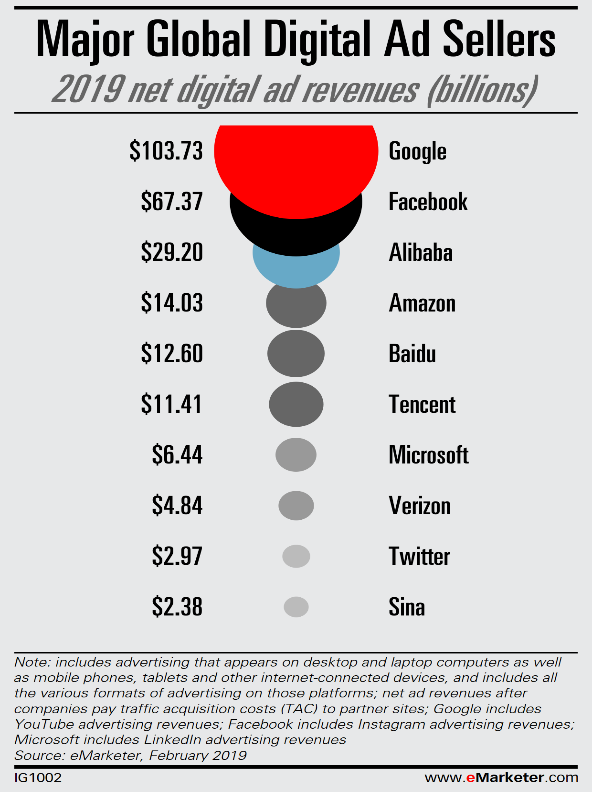
Google remained the most significant digital ad seller in the world in 2021, accounting for approx. 31.1% of worldwide ad spending ($103 billion). Facebook will be No. 2 ($67 billion), followed by China-based Alibaba ($29 billion). Google and Facebook alone commanded 90% of the growth in digital ad sales last year in the US. Amazon has been steadily chipping away at the Google-Facebook duopoly in the US, but it will be a smaller player on the global stage ($14 billion), although that still makes it the fourth-largest digital ad seller worldwide.
The Facebook-Google duopoly is even greater in the UK. Their combined share of the digital ad market will reach 63.3%, higher than their US share (59.3%).
Conclusion:
The advertising industry is at a critical juncture in developing digital advertising technologies driven by the emergence of key technology platforms.
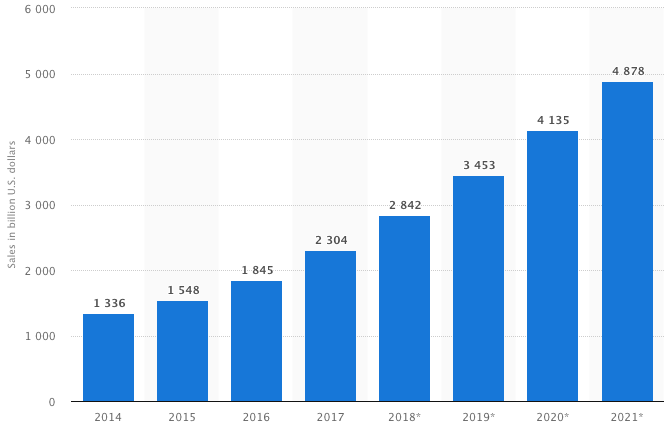
In 2019 retail e-commerce sales worldwide amounted to 3.4 trillion US dollars, and e-retail revenues are projected to grow to 4.8 trillion US dollars in 2021. Desktop PCs are still the most popular device for placing online shopping orders, but mobile devices, especially smartphones, are catching up.
The confluence of new technologies, new entrants and new consumer demands has catapulted retail into a state of flux. These market shifts influence not only how shoppers choose to obtain their desired goods and services but also how and where they spend their money.
Consumers are increasingly turning to online and mobile channels to make purchases that they traditionally would have made at the cash wrap in years past. This deflection of spending has been fuelled, in part, by the rise of online marketplaces and the on-demand economy against the backdrop of new purchase experiences like click-and-collect and mobile order-ahead.
Looking ahead, businesses of all types – and especially those primarily operating in the brick & mortar realm today – must adopt the necessary strategies to meet their customers at the myriad digital touchpoints where they are increasingly looking to conduct commerce. With digital commerce growing more than six times the rate of in-store sales through 2022, it’s more than apparent that a well-executed digital transformation strategy will be a hallmark of long-term, sustainable growth in commerce.
Conclusion:
To increase their profit margins and extend their geographic presence, vendors are making investments in planning, designing, and developing new marketing techniques and acquiring new disruptive technology players. E-commerce is growing nearly 20% YoY and provides an opportunity for websites to capture part of this expanding revenue flow.
The double-digit YoY growth of e-commerce worldwide offers publishers a fantastic opportunity to create a new and stable revenue flow that goes beyond traditional advertising.

Innovation is a constant force driving the evolution of the digital media ecosystem. Digital channels are expected to provide nearly all incremental spend flowing into global marketing budgets through 2021.
Content marketing is a form of marketing that focuses on creating, publishing, and distributing content online for a target audience. It is often used by businesses to: Attract attention and generate potential customers to expand customer base generation or increase online sales. Increase brand awareness or credibility to attract online users. Community content marketing attracts potential customers by creating and sharing valuable free content. Turn potential customers into customers.
Content marketing has exploded in the last few years. According to analysts from Technavio, the industry is projected to be worth $ 413 billion by the end of 2021.

a. It’s a slow journey to see returns from content marketing. It takes months to gain traction, climb the search engine rankings, and begin building authority.
b. In the early days, lots of brands didn’t wait long enough to see the promised results. Others couldn’t see the value in content, mainly because adopters weren’t sure how to prove ROI.
c. However nowadays, the benefits start coming into focus. We can measure content marketing and point to concrete numbers that show exactly why it’s an excellent investment. As a result, more businesses are investing.
d. Proof of that can be seen, for example, in the global content marketing software market. From 2018 to 2023, it’s expected to enjoy a compound annual growth rate of 18.4%. It should surge from $ 4 billion in 2018 to $ 10 billion in 2023 (According to GlobeNewswire).
a. One of the main reasons content marketing is enjoying explosive growth is a simple fact: Modern consumers are using the Internet for almost everything, including news and information, entertainment, communication, education, shopping.
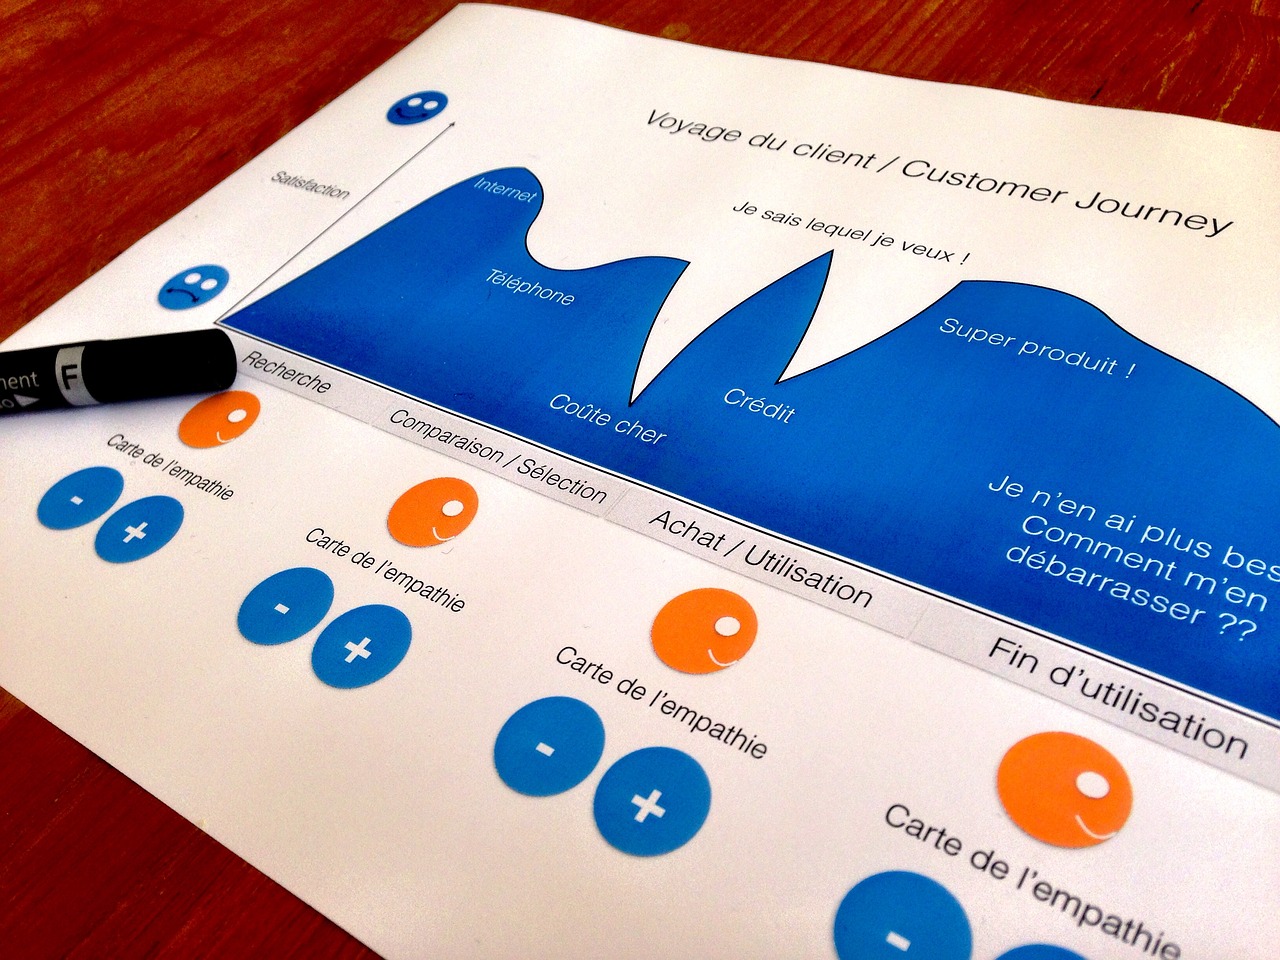
b. In particular, when it comes to shopping, today’s consumers aren’t limiting themselves to special purchases or certain types of goods. They’re buying everything you can think of, including consumer packaged goods like non-perishable grocery items, beauty products, and personal care products. According to a 2018 Periscope by McKinsey survey, 70% of respondents shop this way. Of course, their purchase decisions are affected by the Internet, too. Consumers now have the means to thoroughly research products, share their shopping experiences with a broad audience, and generally take more control over how and what they buy.
c. Combine these points with the fact that most online activity begins with a search, and you’ll start to see why content marketing fits in so neatly. Consumers are savvier than ever before, and their buying journeys are more complicated. They can smell a sleazy sales pitch from miles away. They know when brands are being genuine and when they’re just grabbing for money.
d. That’s why they respond so well to the non-sales approach of content marketing. Content provides value. Content answers questions and addresses pain points. Content builds trust and loyalty and creates customer-brand relationships.
e. The amazing part is brands are now seeing that meeting customers at the door of their search with valuable content works far better than trumpeting cold ads in their face. The cold ad approach is dying because customers are not responding the same ways they used to.
What are the trends:
Content Marketing, “the most economical and effective”
The marketing specialist website The Drum recently collected some statements by Ujjwal Doshi, lead analyst at Technavio for media and entertainment: “Content marketing is the most economical and effective means of building brand awareness among consumers. If an audience can rely on a company for information, then they will most likely buy products from the same company. ”
According to this source, sponsored content has taken off as advertisers seek new ways to skirt ad blocking software while delivering tangential benefits in terms of improving search engine optimization, social media followings and PR.
80% of marketers outsource content
The latest Content Marketing Institute (CMI) report highlights that 59% of marketers expect their content marketing budget to increase this year, and eight out of ten marketing managers declare that they outsource content production. Not only can it make financial sense in the short term, but it drives greater long-term ROI by giving the people (and therefore Google) what they want.
Conclusion:
Digital Marketing is now mainstream. Digital Marketing Technology has emerged as one of the most exciting beneficiaries of recent advances in bandwidth, mobile computing, networking and cloud delivery technologies. From content creation to the actual ad impression, the Digital Marketing ecosystem is teeming with a vibrant community of participants, all involved in a rush to market ahead of their competitors and the more prominent established players. The acceleration in the growth of spending on digital media-based strategies has created attractive investment opportunities from startups through IPOs with significant M&A opportunities along the way.
The market for digital marketing remains one of the highest growth opportunities. The technology infrastructure and marketing expertise required to deliver this solution are significant in capability and sprawling in scope. Companies in all sectors, especially those with more competition on the Internet, are looking for alternative strategies that are more profitable in the long term and with greater customer engagement. Content marketing is gaining ground as one of the most effective ways to reach and retain customers without using aggressive sales tactics.
Among the growth factors of the sector will be:
1) The adoption of powerful content policies by businesses to generate engagement, personalization and generate interest.
2) The cost of Content Marketing is lower than traditional advertising in the long run.
3) Social media will continue to grow strongly in the coming years.
4) Consumers are migrating from conventional shopping channels to digital ones.
Severin Renold
Weissknight Corporate Finance
Cyber Security – Digital Identity & MFA
Proving one’s identity is clearly critical to participation in societal, political, economic, even cultural life. Trust is a precious commodity earned over time and challenging to build between consumers and businesses in an online world. This requires businesses to apply the right tools and relevant information to identify them. Unlike face-to-face encounters, digital interactions lack the visual cues that normally builds trust. As digital interactions seem anonymous businesses and consumers must find ways to establish mutual trust.
Digital commerce is expected to grow globally at 20% CAGR by 2022, reaching nearly $ 6 trillion in value and digital banking users (online and mobile) exceeded 2 billion in 2018 with an expected 11% CAGR (2019-2023), where mobile banking users are expected to be 58% of the global banked population in 2020. That means it is imperative that businesses build meaningful digital customer relationships based on trust. What does it take to build trust online? Practically speaking, it is about maximizing both security and convenience.
There are some important differences and similarities between authentication and digital identification, which need to be outlined to understand the markets.
Identity verification – Identification is the method to prove we are who we say we are. This is different from identity, which is a person’s unique group of characteristics. Identification is the method to authenticate identity.
Authentication – Authentication is the extension of the first identity verification in a user’s onboarding. Once the user’s identity has been verified, the user authenticates themselves to make the purchase, get the loan, or open an account.

A trusted digital identity is a set of verified attributes that provide an authenticated link between a person and their unique digital identity. These attributes can be biometrics, identification documents, or third-party verification procedures, among others. A trusted digital ID is usually created in three steps: capturing verified attributes, verifying the records, and digitizing the ID.
The World at a glance
Proving one’s identity is clearly critical to participation in societal, political, economic, even cultural life. Still, more than a billion people in low-income economies lack any formally recognized ID – either paper or electronic – negatively impacting underprivileged groups in Africa and Asia. A digital identity presents a life-changing solution opening up for access to retirement and unemployment benefits, education, healthcare, voting, and more.
Financial institutions
Digital ID could give access to financial services for 1.7 billion-plus world citizens who are presently financially excluded, according to the World Bank (2020). In contrast, millions of consumers open new accounts daily in the digitally connected parts of the World, with online stores, telecom, streaming services, ridesharing apps, and, naturally, banks.
Opening a bank account includes time-consuming and complex KYC (Know Your Customer) checks and repeated identity verification throughout the entire client life cycle. KYC help identify money launderers, tax fraud, and other criminal activities. With the entry of PSD2 and customer convenience demands, physical, face-to-face identity verification methods are no longer rational; they slow down onboarding, frustrate pressed-for-time customers, leave room for human error, and are hard to scale. Digital identity verification is the logical approach, accelerating the entire process, opening up access, and eliminating barriers like time, geography, and cost. Mobile banking users are expected to be 58% of the global banked population in 2020.
The covid-19 pandemic effect on online banking
The no-contact, quarantined pandemic has pushed a global shift towards digital transactions, speeding up trends already in place. Consumers firmly demand digital transactions, and banks and businesses must find ways to build trust in a Covid-stricken world.
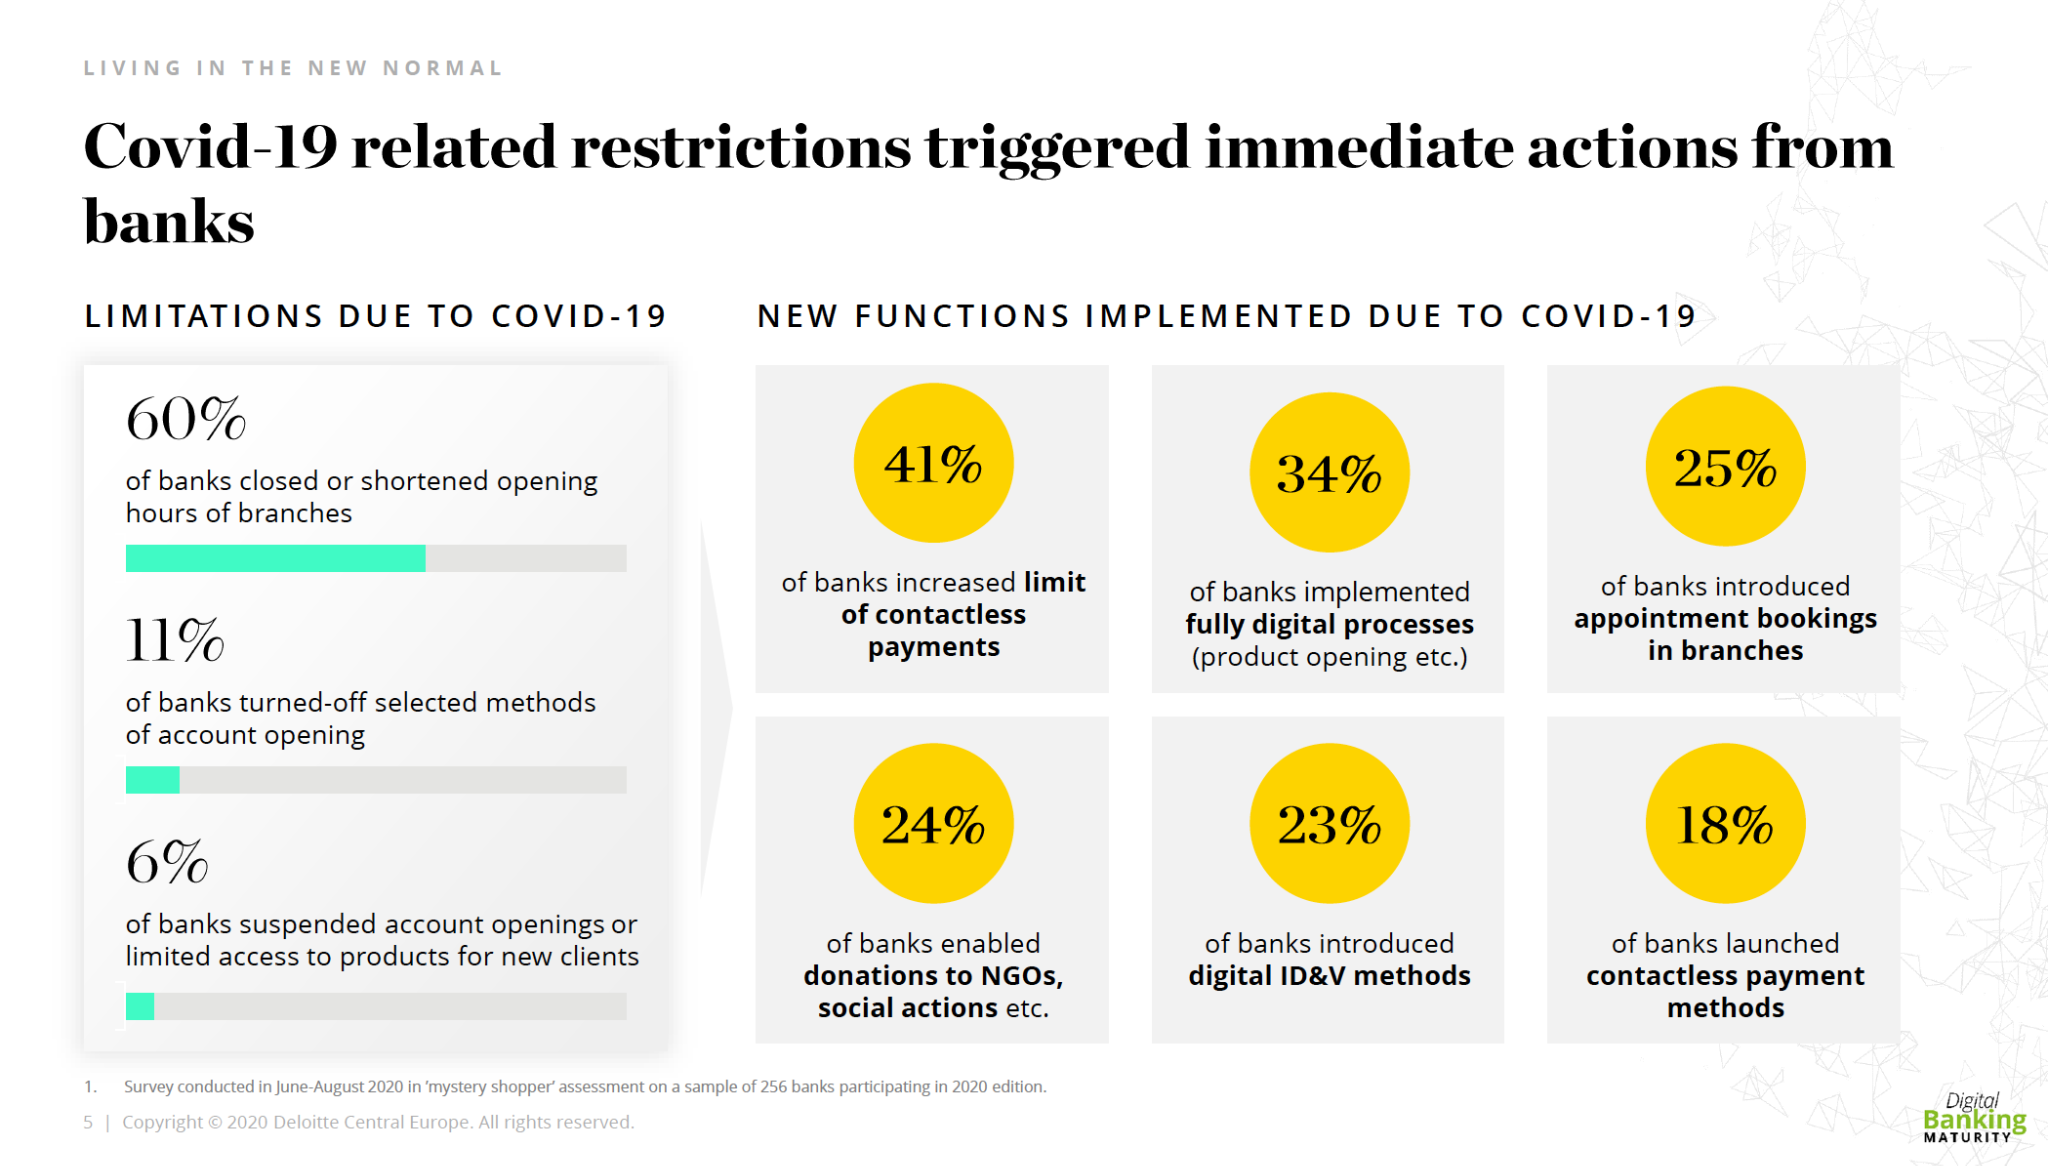
(Deloitte Digital, October 2020)
State and government
Besides security for both nations and citizens, well-implemented digital ID programs can provide individuals and businesses with access to the entire set of governmental services. Creating a trust framework for digital ID is therefore high on every government’s to-do list. In many connected countries, like Sweden, Belgium, Estonia, Finland, and more, a national mobile digital ID, valid for both physical and digital realms, is already a reality for millions. Sweden stands out as it has raised the bar very high in digital identity verification and authentication. Most Swedes use their smartphone to identify themselves over the internet without ever having to show a physical ID. Instead, authentication is done with the trusted mobile identification solution Mobilt BankID, which today is the Swedish national standard for mobile and online digital identification with a 98% adoption rate and 8 million users. Mobilt BankID is also recognized by the Swedish government.
Commerce
In-app purchasing, person-to-person payments, and e-wallets result from consumers’ relentless demand for instant access to their money. This is why the most convenient and readily available device of them all – the smartphone – is the payment channel of choice. Sending money to friends and family, shopping, or doing day-to-day things like paying a bill inside various apps are examples of consumer behaviours taking off phenomenally. In doing this, today’s consumers also expect a seamless customer experience. So, for merchants, customer enrolment is all about the balance between security and customer experience.
A complex ID verification/authentication process will turn customers away. A well-designed digital identification/authentication method, on the other hand, allows businesses to doubtlessly know their customers while providing enhanced security, greater scalability, better user experience, and regulatory compliance. Moreover, digital ID verification boosts efficiency and lowers the costs of handling customer credentials.
The arena for digital identification has risen due to recent years’ demand for greater security and data privacy, in line with the growth of digital services Worldwide. The market is fragmented and diverse, and a clear definition of what constitutes a digital identity – which can be presented with a digital ID – is yet to be determined.
To evaluate the Identity Verification market, it’s necessary to add a dimension beyond the number and type of digital ID providers, and it’s the kind of authorizing source(s) the digital IDs use for identity proofing:

Multifactor authentication is recognized worldwide as the most secure method to on-board new customers to services that demand strong customer authentication (SCA). In addition, it assists in compliance with strict regulations such as the Anti-Money Laundering (AML) Directive and PSD2 in Europe.
Today countless vendors are claiming to offer multifactor authentication (MFA) solutions. However, they still have security flaws – primarily as they still depend on passwords or other authentication tokens.
What has been considered the most secure form of authentication is password-less. Password-less authentication emerged as a type of MFA that replaces the password with a safer alternative, like biometrics or PIN codes. This form of authentication requires two or more verification factors that are secured with a cryptographic key pair.
Besides the technological security solution, multifactor authentication tends to rely entirely on user experience as the main driver and primary competitive advantage.
The ease of online shopping, peer-to-peer money transfers, and seamless payment systems makes identity the new treasure trove when it comes to cybercrime. Cybercriminals hijack identities and grab credentials in numerous ways: skimming’s, phishing, malware, and significant, brute force data breaches, to name a few. As data is everywhere, the avalanche of digital services has created numerous customer touchpoints and a long tail of micro-moments that widens the attack surface, and where each one poses a possible entry point for an attacker. Cybercriminals know that businesses, in many cases, rely on weak passwords, SMS or email link confirmation, or One Time Passwords (OTP) to authenticate their users – all of which are very easy to crack, hack, and steal. Data that’s been stolen ends up on the dark web – a part of the deep web – a hidden part of the internet that is not indexed or accessible by search engines. The dark web is where cybercriminals buy and sell malware and cyberattack services, which they use to assault unsuspecting victims, businesses, governments, and individuals.
The FBI has estimated the size of the deep web at as much as 5,000 times larger than the “surface web,” and growing at an inconceivable rate. So, there is a considerable gap between the amount of data being produced today that needs security and the amount of data that is actually being secured, and this gap will broaden as a consequence of all things digital. Nearly 90 percent of all data created in the global data sphere will require some level of security by 2025 (Data age 2025: The evolution of data to life-critical, Seagate, March 2017). Once an identity is stolen, an impostor can pose as the actual customer, using their standing and track record to open new accounts, take loans, or use a person’s credit cards to make unauthorized transactions. More than 2 in 5 consumers worldwide have already experienced a fraudulent event online at some point in their lives, with the highest incidence occurring in the United States, closely followed by the UK and the lowest in the European, Middle East, and Africa region.
Another downside is that identity theft, and account takeovers are increasingly threatening businesses. Besides substantial financial losses on both sides, account takeovers, data leaks, and credit card fraud can tear banks’, public entities’, and merchants’ reputations apart. Many reports are stating multi-billion-dollar costs after an actual cyberattack and the gruesome costs for preventing them. In a widely cited estimate by The World Bank, institutions lose nearly three dollars once associated costs are added to the fraud loss itself for every dollar of fraud.
Estimated global losses from cybercrime are projected to hit just under a record $1 trillion for 2020 as the coronavirus pandemic provided new opportunities for hackers to target consumers and businesses (Center for Strategic and International Studies).

The digital-ID opportunity grows as costs drop, technology improves, and access to the internet and smartphones goes up. The digital infrastructure that supports digital ID grows in range and decreases in cost daily. As usernames and passwords are no longer secure, even forbidden for banks as a method of authentication according to PSD2 new security approaches are needed.
The market for Identity, Authentication and Fraud Solutions will reach 28 billion dollars by 2023 and identification will be an increasingly important component of that market. (BCG Research and analysis).
Market trends:
Drivers and opportunity: Increasing digitalization with initiatives, such as eID and intelligent infrastructure.
North America to hold the largest market size during the forecast period: North America is expected to contribute the highest market share in terms of revenues during the forecast period as it is a technologically advanced region with an increased number of early adopters and the presence of significant market players. Factors such as the development of government initiatives, like intelligent infrastructure, smart cities, digital identity-based driver’s license and increasing integration of various technologies, such as AI, ML, and blockchain, for securing digital identities are suspected of driving the demand for identity verification market.
Asia Pacific is expected to contribute to the fastest-growing region with the highest CAGR during the forecast period as it is getting equipped with the early adoption of new technologies. The government takes factors such as Initiatives towards tackling identity-related frauds, mainly for strengthening eKYC to verify identities, such as compliance regulations initiated by countries, increasing demand for cloud-based identity verification, and increasing identity-related cyber-attacks are driving the revenue growth in this region.

Conclusion:
Established identity solutions providers and startups alike are building capabilities and pursuing patents and acquisitions. In 2017, there were 226 identity deals funded via the private equity market, according to CB Insights, up from 123 in 2012. Yet even with all the investment and interest, the market still lacks a clear leader.
Below are three significant challenges to explain why this is the case:
The market presents a paradox. The startups that have promising technology often don’t have sufficient scale, while the established players that do have the necessary scale frequently don’t have the innovative technology. Either way, compelling advances in identity authentication aren’t utilized to their full potential.
Severin Renold
Weissknight Corporate Finance
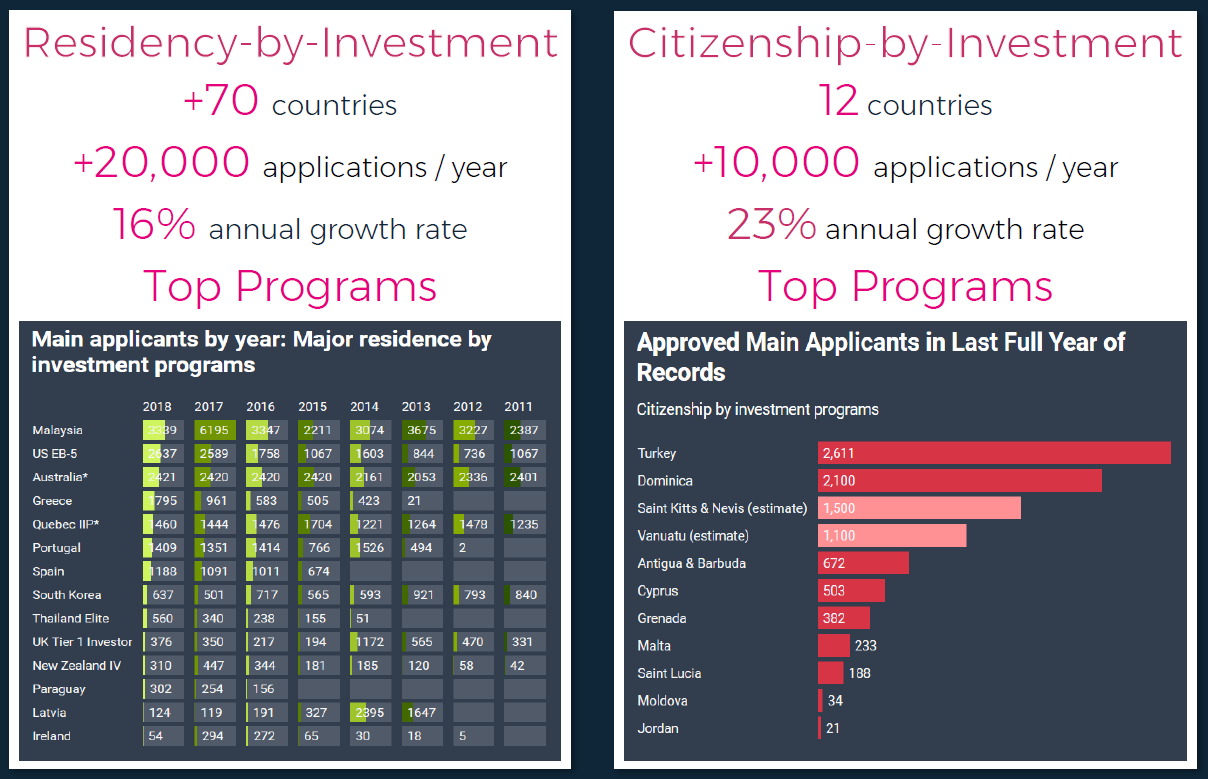
Residency & Citizenship by Investment
The investment migration market has grown from $ 2.9 billion in 2011 to $ 21.4 billion today.
Before selecting an investment location, investors should consider the outcome of their investment (residency or citizenship), the type of investment required, processing times, any long-term commitments demanded by the program and any restrictions on dual nationality.
According to the 2021 Investment Migration Executive Survey, interest in Residency and Citizenship-by-Investment has increased significantly since the start of the Covid pandemic.
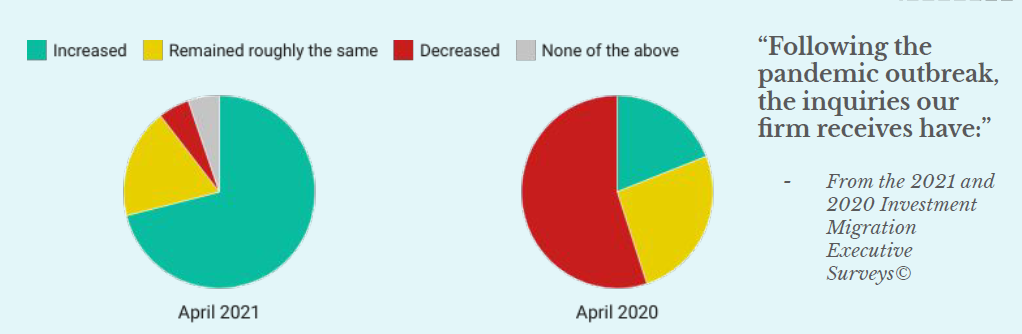
The pandemic has undoubtedly acted as a driver of growth, putting a spotlight on the many benefits of strategic residence and citizenship planning.
At no other time in our history has humanity been as mobile as we are today.
There are three main propositions in the RCBI marketplace:
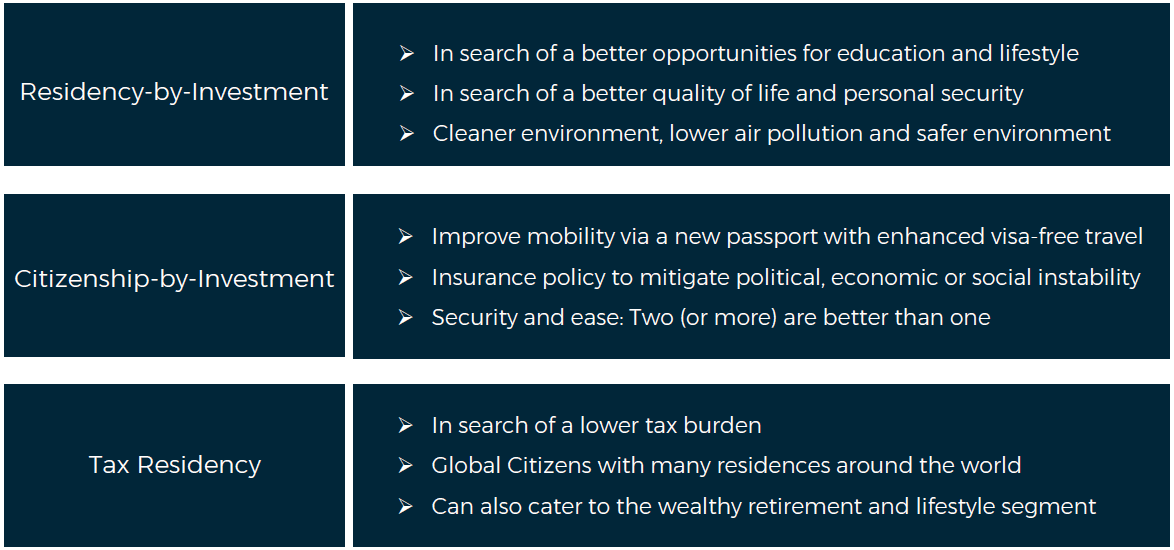
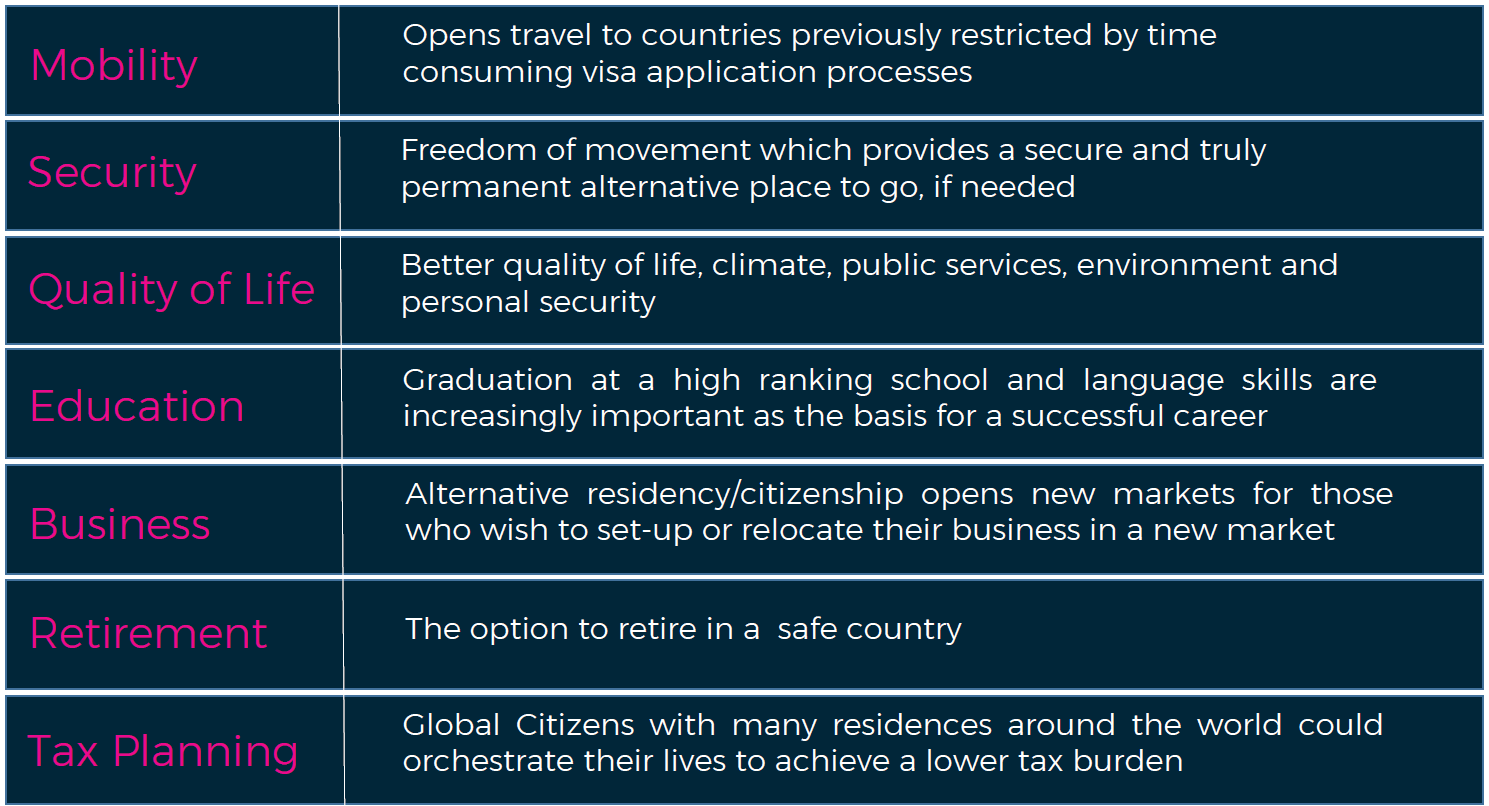
Reasons for alternative Residency or Citizenship:
Who would have thought at the turn of 2020 that an invisible virus would become the story of the year, killing hundreds of thousands within six months and placing the global economy in a coma? Borders have proliferated within Europe to a degree unmatched even during the so-called refugee crisis. Two-thirds of the world’s fleet of airplanes have been grounded as passenger air traffic has fallen to rates last seen half a century ago.
When it comes to investment migration, the pandemic has underscored the critical differences between citizenship-by-investment and residency-by-investment, so often treated together, as well as the distinction between citizenship and mere passports. It also raises questions about how supply and demand will transform in this unusual market.
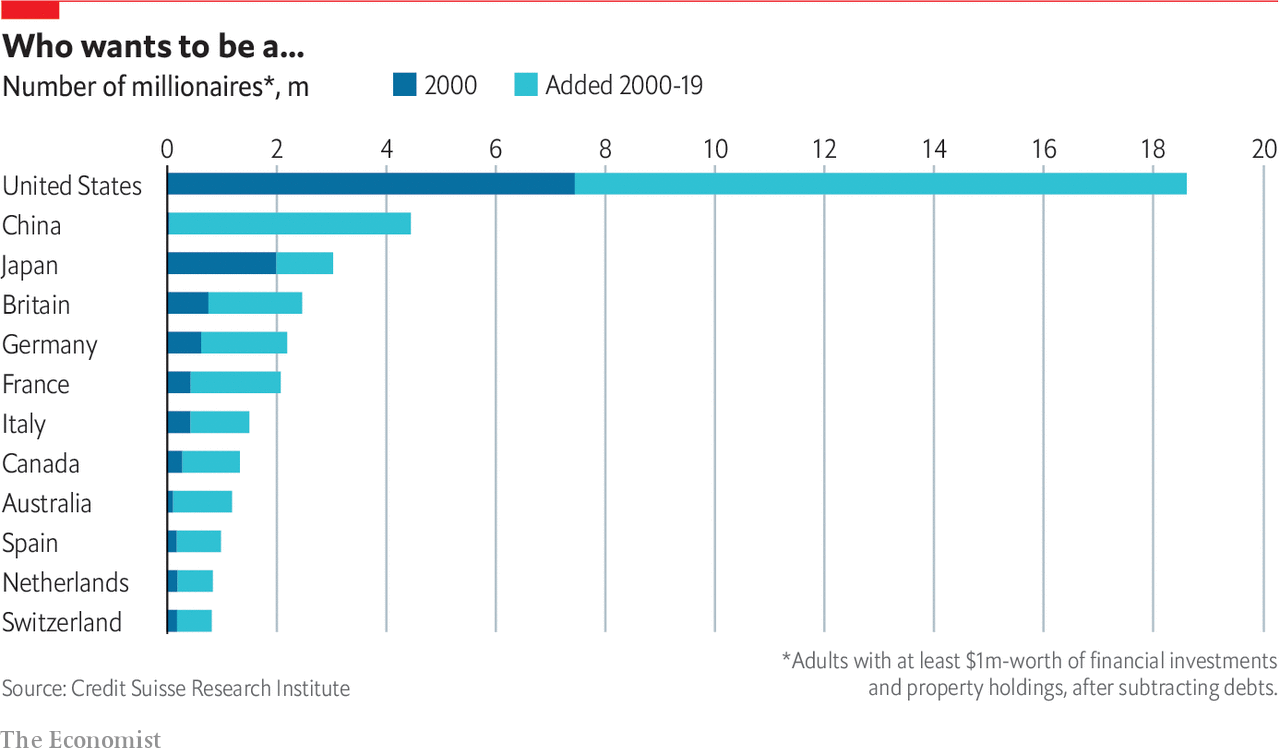
What does the pandemic mean for millionaire mobility through investment migration?
Microstates in the Caribbean will become ever more dependent on citizenship-by-investment (CBI) as a revenue source until such time as tourism, their economic mainstay, makes a comeback. Even economically more robust and more diversified economies, such as Malta, where CBI is a smaller proportion of government revenue, the allure will remain as other parts of the economy contract.
The supply side of the market will remain strong, if not expand. The crucial question is where? The most recent entrants in the market have been more sizeable states than its mini pioneers, with the UAE and Turkey now attracting investor citizens, and Egypt in the waiting room now that it has passed a law to facilitate investor naturalization.
The key issues that emerge concern what naturalization offers and how these rights are secured.

People will think twice before queuing at an airport and hopping on a plane. Flights will be fewer and more costly. We all now know how much can be accomplished on Zoom and without jetlag or waiting. Even if holiday travel recovers, lockdowns have proven that much business travel is surprisingly expandable.
This is why we might see residency-by-investment (RBI) grow at the expense of citizenship-by-investment (CBI).
The long history of famous passive residency-by-investment programs in these regions makes them known quantities. But in recent years, Europe has emerged as a second desired area, ticking several boxes of interest as well, particularly given the privileges provided by the Schengen treaty.
This does not signal an end to citizenship-by-investment. Indeed, citizenship will always confer more privileges than mere residency status alone, but mobility demands are likely to change, with the weight shifting from present mobility and border crossing ease to future mobility and a Plan B. The result will be an expansion of demand for RBI in wealthy and highly-sought countries.
Under such conditions, citizenship options and other secondary considerations fall by the wayside as expendables that can be cut during tough times. The super-wealthy one percent of the one percent – more likely to splash out millions for membership in an EU country – have taken less of a hit, and their interest in these programs have indeed risen since late 2020, particularly from the USA.
Severin Renold
Weissknight Corporate Finance
Insurance and IOT in the automotive industry
The insurance industry is a major component of the economy by virtue of the number of premiums it collects, the scale of its investment and, more fundamentally, the essential social and economic role it plays by covering personal and business risks.
The global insurance market faces a truly unique moment in its history. The fundamental disruption caused by the COVID-19 pandemic equates to an opportunity for the industry to remake itself in line with new societal realities and market needs.
Maturing markets, tight capital, increasing risk and technologically sophisticated customers are just some of the pressures the insurance sector faces today. The global insurance industry is at a watershed moment. Insurance leaders have witnessed the growing impact of fintechs – financial technology startups – who invest in insurance technology (insurtechs).
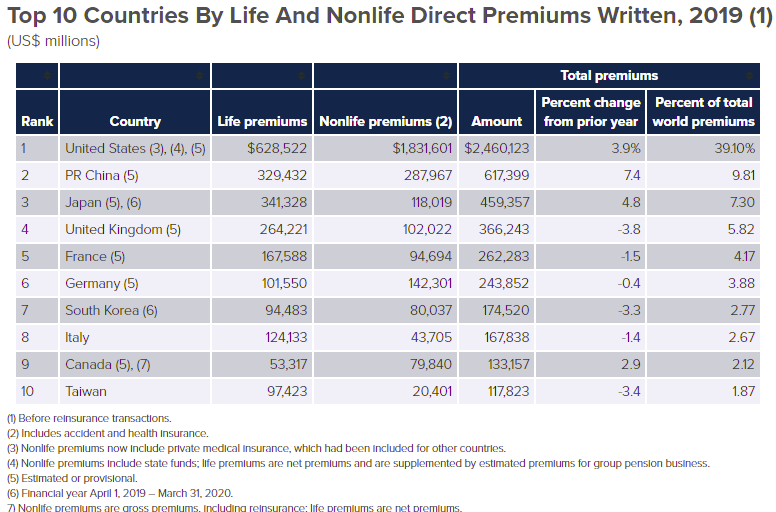
The insurance industry is divided into life and nonlife (or general insurance); the value of the market is shown in terms of gross premium incomes. The life insurance sector consists of mortality protection and annuity. The nonlife insurance sector consists of accident, health, property and casualty insurance segments.
World insurance premiums rose 3% in 2019, adjusted for inflation, to $5.1 trillion.
How the COVID-19 pandemic changed customer needs:
Tech and insurance industry – INSURTECH
After a long period of slow change, the insurance industry is finally following suit. Leading insurance businesses are starting to better connect risk with customers by partnering with or being inspired by dynamic new startups – insurtechs – across the insurance sector.
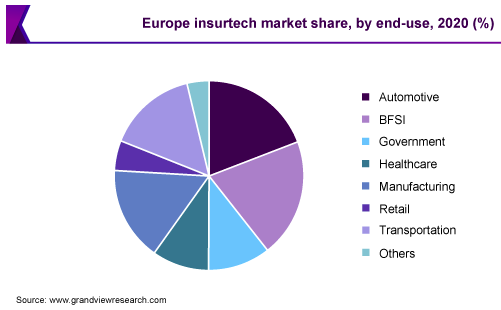
The global insurtech market size was valued at $ 2.7 billion in 2020.
Insurtechs and the venture capitalists who fund them are looking to accelerate a shift of the industry away from traditional insurance products toward personal risk management, micro products and insurance-as-a-service. Individuals can employ these to manage their own risk rather than pay whole premiums for insurance companies to care for them.
The increasing need for digitization of insurance services is expected to propel market growth. Simplification of the claims processes is anticipated to drive the change. Insurance companies are focusing on improving communication with their clients and capabilities to implement automation processes. They are also focusing on using these solutions as they use technology innovations mainly designed to enhance the efficiency of the existing insurance industry model. These solutions are helping businesses discover avenues that large insurance companies have less incentive to achieve, such as offering social insurance and ultra-customized policies. These solutions use new streams of information from the internet-enabled devices to price premiums according to observed behaviour.
Insurtech is the usage of innovations particularly designed to make the existing insurance model more efficient. By using technologies such as AI and data analytics, insurtech solutions allow products to be priced more competitively. Insurance companies are widely adopting these solutions to drive cheaper, better, and faster operational results. Hence, the insurance industry is witnessing increased investment in technology.
The outbreak of COVID-19 is anticipated to have a positive impact on the market. Numerous insurance companies are reconsidering their long-term strategies and short-term needs. The COVID-19 and its consequences are accelerating the implementation of online platforms and new mobile applications to meet consumer needs.
As per the report published by Allied Market Research, the global auto insurance market generated $740 billion in 2019 and is anticipated to hit $1.1 trillion by 2027, registering a CAGR of 8.5% from 2020 to 2027.
Ø The rise in the number of accidents, implementation of stringent government regulation for the adoption of auto insurance, and surge in automobile sales across the globe drive the growth of the global auto insurance market.
Ø Auto insurance is a contract between the insurance company and vehicle owners that protects them against financial loss in the event of vehicle theft or accident. The insurance company agrees to pay the covered amount of the losses in exchange for paying a premium.
Increasing awareness among end-users, introducing innovative technologies and products, and the availability of third-party insurance providers are to deploy substantial traction for the automotive insurance industry over the forecast period. Automotive insurance companies work with software providers to offer big data-based solutions to satisfy the end user’s concerns and untapped market demand during a car-related transaction.
Furthermore, digital technologies and mobile internet are transforming the vehicle industry and the vehicle/automotive insurance industry. The automotive industry is undoubtedly undergoing significant changes that will help increase asset utilization, change vehicle ownership models, and improve vehicle safety, which will eventually impact the global automotive insurance market. Additionally, autonomous technology has made cars increasingly safer, which is expected to reduce vehicle accidents significantly during the forecast period. Moreover, a rise in on-demand transportation and the shifting of liability to manufacturers are some of the factors that are expected to hinder the growth of global automotive insurance during the forecast period.

Insurtech in the automotive sector:
Connected devices are becoming a prominent part of our daily lives, and many businesses are trying to figure out how they can exploit this trend to create a deeper relationship with their customers. Motor insurers are not immune to the changes that are happening, primarily as they operate in an increasingly competitive market.
Through the launch of value-added services linked to digitally-enabled motor insurance products, insurers finally have the opportunity to differentiate their products and engage their customers in new ways, thereby helping to change their perceptions of insurance products and providers.
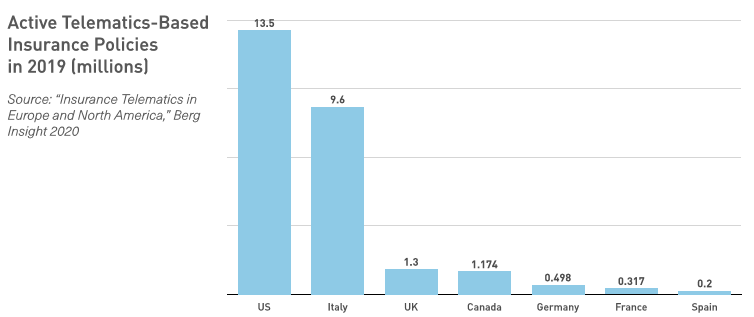
There are clear signs that customers across Europe would value a telematics offering!
The COVID crisis has started changing the automotive insurance industry:
Consumers’ interest in telematics is at an all-time high – and growing. The COVID crisis brought home the benefits of telematics to many drivers. Since then, a flurry of positive articles has reinforced that telematics is the best way to save money on insurance.
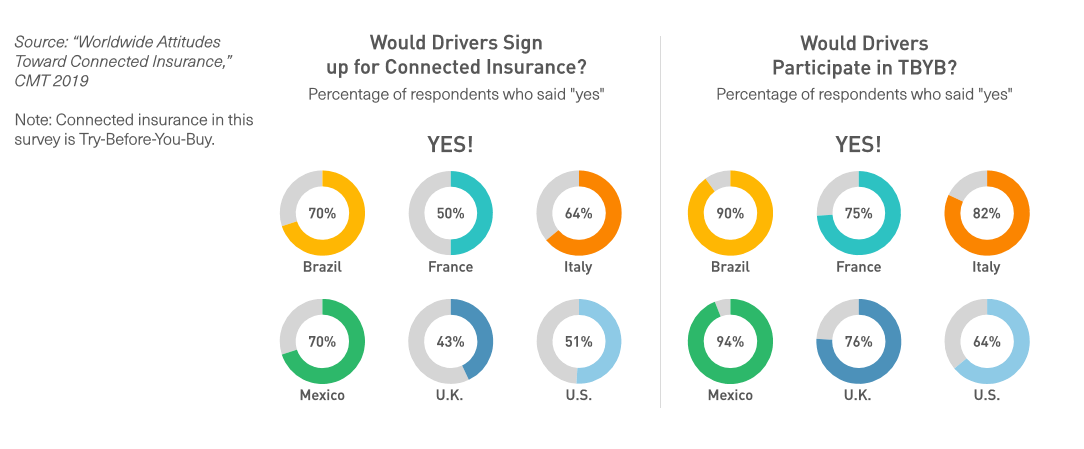
The market and consumers are becoming more and more mature and ready to switch!
Connected insurance provides the drivers with the flexibility they now need since they drive less or differently. At the same time, it provides insurers with the information required to price risk appropriately.
Severin Renold
Weissknight Corporate Finance
Electric Vehicles
The automobile has long been regarded as one of the most important innovations in history, significantly changing people’s lifestyles, quality of life, and productivity. At the same time, the freedom to move, social status, and the fun of driving have fostered an automotive culture, making the automobile a particular consumer product rather than a simple transportation tool.
Transport is critical for the economy. It creates growth opportunities, generates jobs, facilitates trade and realises economies of scale. Mobility is central to the whole of society. It allows people to connect with places and shapes how we live our lives. In the last twenty years, social changes have significantly altered how and why we use the transport system; shifts will likely be even more notable over the next twenty years.
Changes such as the growing, ageing population will meet technological advances in electric power, digitalisation and automation. These technologies will bring opportunities, offer fresh innovation to existing needs, and radical new approaches. However, they will also bring challenges. Realising the full potential of technology requires us to consider how users’ travel behaviour will respond to it and how all of society and our economy can benefit. To be truly transformational, we need to view transport as a system: to consider it as a whole. The future of transport needs to balance a wide range of considerations. Capacity has a role to play, but it must be linked to making travel more sustainable overall, be this through lower emissions, less travel or better relating our journeys to housing and work.
The global automobile industry is on the brink of a vital transformation. Technology is driving this shift, shaped by demographic, regulatory and environmental pressures.

Before the COVID-19 pandemic shook up the automotive industry – along with every other industry – electric vehicles were moving steadily into the spotlight.
The combined annual sales of battery electric vehicles and plug-in hybrid electric vehicles tipped over the two-million-vehicle mark for the first time in 2019. EVs staked their claim on a 2.5% share of all new car sales last year.
In terms of volumes and trends:
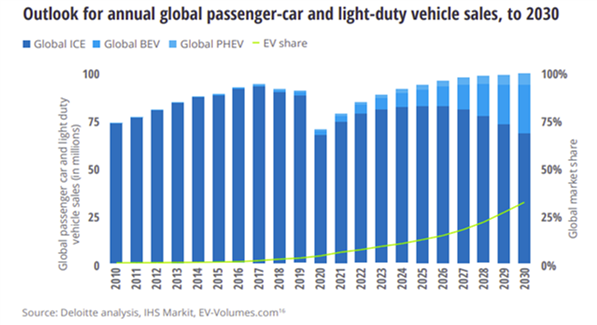
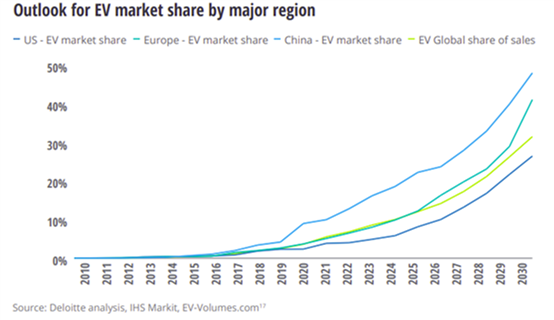
In terms of value and trends:
What is behind and driving this massive growth market:
Consumer demand will fuel the growth of EVs. As the barriers to adoption are rapidly removed, EVs are increasingly becoming a realistic and viable option.
From 2018 to 2020, there were some noticeable changes in consumer attitudes toward EVs. Concerns over the cost/price premium have diminished in every country. Driving range has remained the number one concern in Germany and became number one in France, but there are now fewer consumers citing it as a concern in those two markets. Elsewhere, the lack of charging infrastructure has become the top priority for consumers, reflecting the possibility that they are starting to see EVs as a realistic option and are considering the practicalities of ownership.
Over the next few years, experts expect some barriers to be completely removed. EVs’ driving range is already comparable to that of ICE vehicles; price has already reached parity if you consider subsidies in various markets and total cost of ownership, and the number of models available is increasing.
Government intervention continues to play an essential role in driving EV sales, as shown by the successes in Norway, fluctuating sales in the Netherlands and changing fortunes of the Chinese EV market.
Not only are there economic benefits for states that support a transition to electricity, but the positive environmental impact has made the widespread adoption of EVs a necessary step toward achieving climate-change goals, such as those of the 2015 Paris Agreement. Several policies and regulations are helping encourage the growth of EV adoption.
In the past year, some prominent OEMs have announced strategic commitments to EVs. New models have been announced, production targets increased, and sales targets moved forward and multiplied. The impact of the investment and targets will represent a seismic market shift over the next decade regarding the availability and affordability of models.
According to statistics cited by the European Federation for Transport and Environment, Europe should expect 33 new models in 2020, 22 in 2021, 30 in 2022 and 33 in 2023. This means that EV models available in the EU will surpass 100 in 2022 and reach 172 in 2025. In the United States, IHS Markit predicts 130 available models by 2026, offered by 43 brands.
The top 29 OEMs already plan to invest more than $ 300 billion over the next 10 years to develop capacity production further, and all of them make the claim they can do so profitably. Assuming that global weaning from fossil fuels continues, automobiles will contribute fewer greenhouse gases on a “well-to-wheel” basis over time.
Achieving price parity with, or even savings over, ICE vehicles will play a big role in speeding up EV adoption, especially as model ranges and marketing priorities adapt to manufacturer emission targets. Even with more OEMs offering affordable EV models, consumers are still unwilling to pay a premium for an EV instead of its ICE equivalent. However, experts expect the existing price premium associated with EVs to be consigned to history sooner rather than later.
Experts see an increasingly important role for corporates to support EVs’ transition, using the three factors highlighted above to their advantage.
Sales of new cars to businesses represent a significant proportion of all vehicles sold.
Compared to internal combustion engines vehicles, EV have a significant advantage – battery technology developments are faster than those of the engine technology on gasoline-petrol based cars.
In addition, the trend of packing electronics in today’s automobiles shows that innovations in electronics will outpace other innovations. The amount of electronics in an EV is high compared to conventional vehicles. It offers opportunities for more innovations. The electric car of the future will be a proper computer on wheels and will change the automobile‘s character.
As an example:
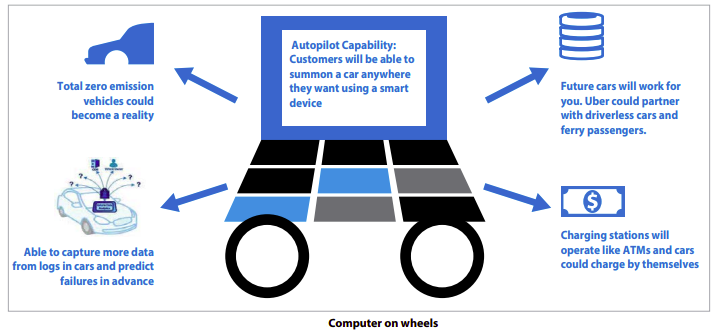
The major shift within the automotive industry due to the growing part of EV is, therefore, the technology and innovations embedded into the vehicles.
With software and other technologies taking the lead, it’s no surprise that consumer tech companies are entering the automotive world. While a car may not be a mobile phone, these businesses’ focus on design, ease of use, automated assistance and battery life will bring new kinds of innovation to the field. One catalyst for tech innovators to move into the automotive industry now: electric vehicles have just 1/3 of conventional vehicles’ parts, lowering the barriers to entry.
The Internet of things has demonstrated how connecting everyday devices to a network could transform what we can do with them. According to several Tech specialists and automotive experts, the Internet of cars will do the same. Connected vehicles, communicating with each other and with the larger world, will not only reduce accidents and ease traffic, but they will also have powerful effects beyond the auto industry. Insurers, for example, will have new ways to monitor driver behaviour, reward good drivers and distribute costs to bad ones. And ride-sharing companies can better connect idle cars with the customers that need them.
Ridesharing may be a mixed blessing for the auto industry. The majority of vehicles worldwide are used only to commute or for short trips during the day, leaving them idle 95% of the time. Connected cars—especially self-driving ones—could also change the way people use their drive time.
There is a clear market window for low cost, electric city cars in Europe.
Improvements in battery technology have resulted in small and light electric vehicles (LEVs) appearing on the market in Europe since 2015. However, their market share is still comparatively small due to their excessive price.
Cities today face problems resulting from increased mobility needs, which are often still tied to private car ownership and auto-centric transport infrastructures that have grown historically.
A key element in urban mobility planning for many cities today is promoting ecologically, socially, and economically sustainable mobility options. Light electric vehicles (LEVs) are becoming an extensive element in sustainable mobility concepts within urban and rural areas.
City cars have historically been the low cost, entry-level vehicles in Europe, representing a consistent 8.5% of annual car sales on average (1.2 million vehicles per year).
New European emission standards have made this an unprofitable segment for most European OEMs, leading them to shift their A-segment vehicles to electric or discontinuing these models altogether.

On top, very important to realise that European car buyers have a strong preference for vehicle brands with a European country of origin.
Due to the higher prices of electric vehicles, early adopters of EVs have skewed affluent, with 60% of buyers having an average household income of over € 100,000 per year.
Only 13% of prospective car buyers in Europe are willing to pay more than € 2,000 more for an electric car vs a comparable petrol model.
Conclusion:
We live in a time of unprecedented change in the transport system. Changes in the nature of working and shopping, new technologies and behaviours – such as automation, vehicle electrification and the sharing economy – are already having an impact on how the system functions, while the intersection of the physical and digital realms is changing how transport is planned and used. These developments bring exciting possibilities which, if grasped, will bring significant social benefits.
The challenge facing cities throughout Europe concerning climate change, air and noise emissions are substantial.
Electro-mobility and small electric vehicles provide a significant opportunity to address the negative externalities associated with the internal combustion engine without constraining the vital role that vehicles play.